Top Forex Brokers
What is a Pin Bar / Candlestick?
The pin bar setup is an easy to spot, objective setup that is consistent and produces a high-win rate. It is a pure price action method: that means there’s no use of indicators beyond the price chart, and it is timeless.
Definition of a pin bar: the body of the pin bar is within the top third or bottom third of the entire candle range.
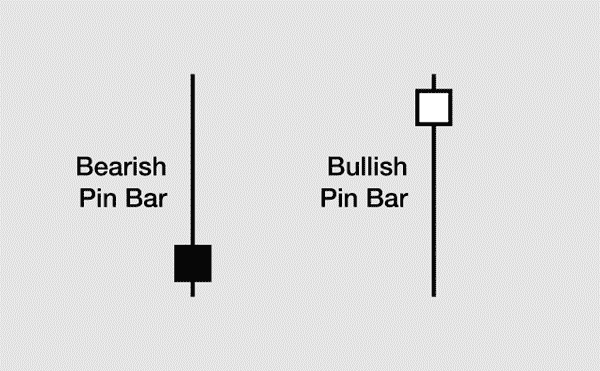
A pin bar / candlestick must have the following:
- Open and close within previous bar / candlestick
- Candle wick minimum 3 times the length of the candle body
- Long nose protruding from all other bars (must stick out from all other candles)
Bearish Pin Bar Example
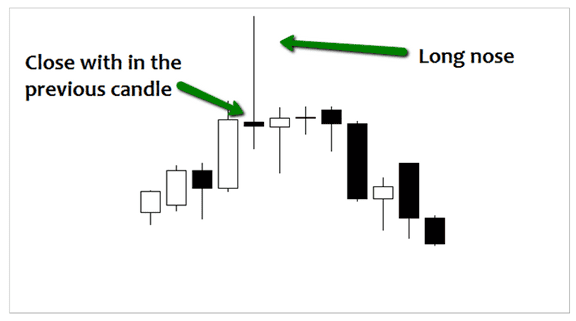
The pin bar can be traded with or against the trend. Quite often you will find pin bars will be the catalyst for the market trend changing directions.
Bullish Pin Bar Changes the Trend
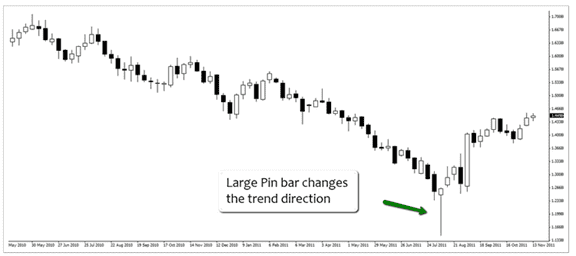
Another common definition of the pin bar / candlestick is a candle where the entire body is in the top third or bottom of the total candle length. That gives the candle an appearance of a pin. It signifies a reversal and if taken with another piece of information on your chart, such as a previous support or resistance, it signifies a strong reversal because there is “confluence”.
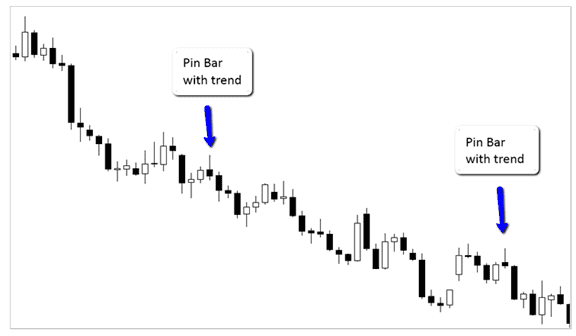
When learning to trade the pin bar it is advisable that traders only enter in the same direction as the obvious higher time frame trend. Trading against the trend can be extremely difficult. The new trader must first learn how the markets operate and also how to trade within a trend before attempting to trade against the trend.
Pin Bar Example with Trend
Once traders have a firm grasp of what the pin bar looks like they will begin to notice them popping up all over their charts. This does not mean every pin bar should be traded. Not all pin bars are created equal.
The best pin bars are the ones that form after a pullback in the market. Pin bars that form without a pullback in the market can be dangerous to trade. Pin bars are reversal signals and traders need to look for them from swing points or pullbacks in the market. Pin bars are not continuation signals and to try and trade them as such is not advised.
Pin Bar from Pullback in Market
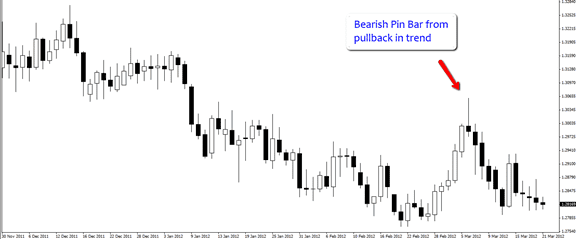
Pin bars can be very powerful price action entry rules signals when traded from the correct areas in the market.
Understanding the Pin Bar Reversal
The pin bar reversal is a price action signal that can be found on nearly all markets and time frames. The term pin bar (short for Pinocchio bar) was originally termed by Price Action trader Martin Pring because of the pin bar’s long “nose”. The pin bar will often catch traders trying to play a breakout before snapping in the opposite direction and stopping them out. Pin Bars are excellent for catching reversals in markets and also for entering trades with the trend from pullbacks.
Simple Success with the Pin Bar
Trading a pin bar can be simple. The fundamental and political events surrounding the market are complicated and change over time. The technical principles based on human reactions to those events do not change, because human psychology does not change.
Let us look at a real-life trade taken on a EUR/USD 4-hour chart:
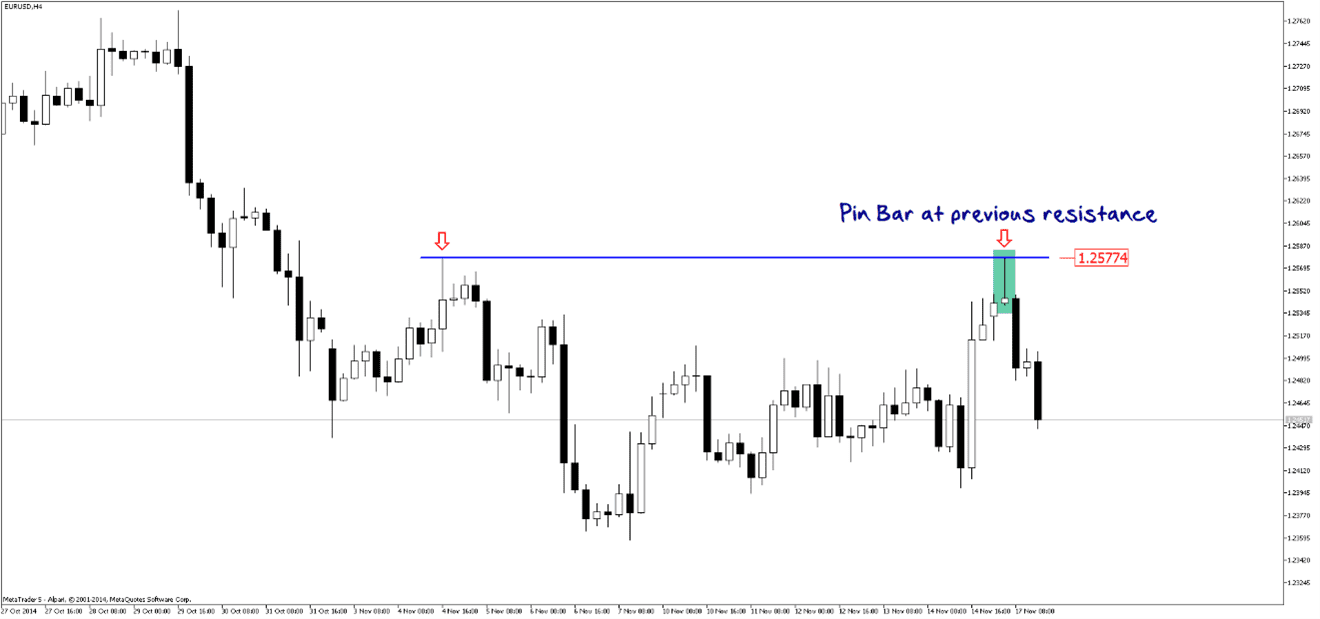
The most recent resistance on the pin bar chart had been marked at 1.2577. When the price returned to that area, it formed a pin bar confirming the resistance. In this case, the tail of the pin bar hit the resistance to the exact pip. Pin bars forming rejections of obvious key support or resistance levels can be the perfect pin bars to trade as reversal signals.
The trade here was entered with a market order at the open of the next candle. The stop-loss was placed just above the high of the pin bar at 35 pips. This trade was aiming for a 1:1 reward to risk ratio.
The profit target was filled by the very next candle.
So that was the entire trade: previously identified horizontal resistance level, pin bar at resistance, short entry with target & stop-loss: simple.
Here is another example, from the daily GBP/USD chart. This pin bar very plainly lined up with previous resistance coincidentally made by another pin bar some months previously. That marked a key resistance level: prior to that level, the price had run up over 800 pips and then retraced 480 pips. Now as it reached that previous resistance again last week, 1.6309, the new pin bar touched the level within 3 pips. Clearly that resistance is still important and is going to produce significant selling before being broken.

Typically, we would consider two possible entries: the open of the next bar after the pin bar or a stop entry order a few pips below the pin bar. Our stop-loss would be just above the high of the Pin Bar.
Here is another example of a “textbook trade” taken on the daily CAD/CHF (Canadian Dollar vs Swiss Franc) currency cross.
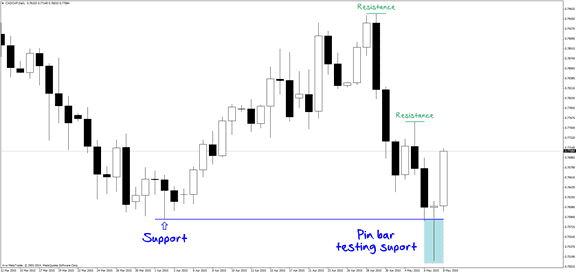
The most recent significant support on this chart was made on 2 April 2015 at 0.7586. After making the support, the price then moved back towards it and produced a Pin Bar on 7 May 2015 as it hit the support level. The pin bar’s wick or tail penetrated the support line nicely and the price closed above the support. This pin bar was showing a clear rejection of that support level. Now, a lot of traders can read into that penetration of the support and the subsequent close above it as a “stop-hunt” move: this is where the market is professionally manipulated to catch stop-losses and short-traders getting in below the support. Whether or not this was an actual stop-hunt move, I do know from my previous experience that when a significant support is penetrated by a pin bar but closes above that level, it presents an opportunity to enter long.
My entry would have been at the open of the next candle. The stop-loss should be a few pips below the bottom of the pin bar, about 103 pips. When entering, make sure that there is not a previous resistance level that would prevent you from getting a target that is less than your risk. In other words, you want to make sure you get at least a 1:1 reward to risk ratio.
Getting the Right Turn with a Pin Bar
Below is a daily chart on the AUD/USD currency pair. The trader here was focused on the price as it approached the blue trendline. If the price behaved in a “bearish way” as it approached the line drawn in the sand, it would have been worth considering a short trade entry.

As the price approached the trendline it made a bearish pin bar (i.e. a bar where the entire body is at the bottom third of the candle). Now, it did not touch the trendline precisely – the high of the pin bar was about 25 pips below the trendline. That said, on a daily chart and in the context of a trendline going back several months, 25 pips are little. And you can judge this distance (or lack thereof) visually on a chart.
It is also worth noting that the high of this pin bar tied in with several points of previous resistance within 10 pips:

Pin Bar Confluence
When learning basic trading concepts, you may have come across the term “confluence”. In trading terms, confluence means bringing several factors together in a setup rather than relying on any one single item to enter a trade.
Let us look at this setup in terms of confluence. A pin bar by itself gives a bullish or bearish bias. But by itself it does not mean we should just jump into a trade. Similarly, price being near a trendline or a previous support/resistance level gives us directional bias, but by themselves they may not necessarily be enough to enter the market. But with this trade setup, I believe we reached an acceptable level of confluence to say to ourselves, “Hey, there is enough going on here telling me that the price is very likely to fall. Firstly, there is a trend line above and the price seems to have bounced off it. Secondly, the daily candle has produced a bearish pin bar. And thirdly, the resistance level the pin bar has formed at its high matches previous resistance levels. I think given all that, in all likelihood the price is going to fall.”
In this trade, assuming an entry at the close of the pin bar or the open of the next bar, and a stop-loss at the high of the pin bar (about 75 pips), you would have seen a 1:2 risk to reward ratio (150 pips profit) being hit within a few bars (i.e. a few days).
When the trade went into profit, you could have managed it in several ways: at 1:1 risk/reward, you could have simply taken your profit. Or you could have taken some of your trade off the table and left the rest to run. And if you left some of your trade on, you could have moved your stop-loss to breakeven. If you’re still in the trade, you would notice another bearish pin bar produced that has bounced against the 61.8% Fibonacci level that could lead to further downward movement:

Certainly, at this stage, whether or not you had taken some profit, you would want your stop-loss at breakeven at the very least. To allow a trade to have gone so far in profit yet turn into a loss would not be intelligent.
As a final note, let me reiterate that even with confluence, you are looking at the “likelihood” of price falling. It is by no means a guarantee. Therefore, you still have to trade with a stop loss and risk a sensible percentage of your account on the trade.
In summary:
1. A pin bar gives a bullish or bearish bias to start looking for a potential trade entry.
2. When you have several factors that align with a setup such as a Pin Bar, you have “confluence”. Confluence increases the probability of your trade succeeding and hence your win rate.
3. Even with strong confluence, you are not guaranteed to win a trade. You still have to trade with a stop-loss and money management rules.
How to Trade Failed Pin Bar Reversals
Sometimes you have the perfect setup for your strategy and the market literally moves in exactly the opposite direction. This is called “Pattern Failure”. Those pattern failures can be just as strong as the original move you were expecting. That means they can be traded too. This is a very often overlooked method of trading, but it can be highly profitable and psychologically extremely satisfying.
Let us dive right in with an example. The below chart is the EUR/USD weekly chart. At the end of the chart are three consecutive bullish pin bars. This presented a bullish scenario, and we could have expected the presumed support shown by the bullish pin bars to hold and EUR/USD to move up.
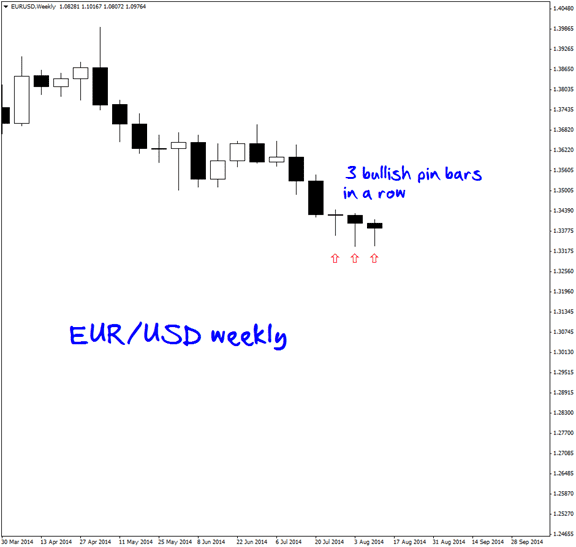
What happens next? Well, you guessed it: EUR/USD breaks to the downside.
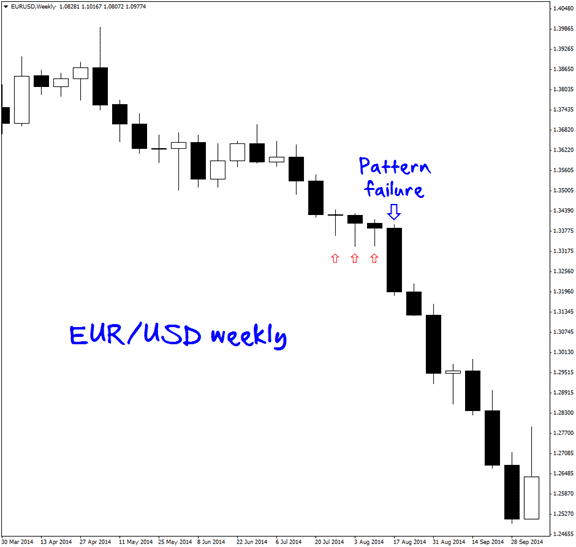
Now, let us break down how to handle this scenario step by step.
Recognize That a Pattern Can Fail
Step 1. Recognize that the pattern can fail. We plan our trades, we put in our stop loss, but we really only think of the trade hitting the target. Once you recognize that the pattern can fail hard on you, you can plan for that also.
Step 2. Let us assume you are in that EUR/USD trade somewhere around the third pin bar. Your stop loss would be a few pips below the low of the three pin bars.
Step 3. You would want to “stop and reverse” that trade if it hit your stop loss. There are several ways to do this depending on which platform you use to execute your trades. If you are using any MetaTrader platform such as MetaTrader 4, there is no inbuilt stop and reverse function. You would simply have a second sell order at the same level as your stop loss. Of course, with the new short trade, you should be sure you put in stop loss and take profit orders.
If you were not in the original long trade but you saw the pin bars fail, you could still just enter a short trade.
Stop & Reverse Trades
Look back at some of your trades that failed but had perfect setups. Look to see if the moves in the opposite direction from the original entries were consistent enough to justify stop and reverse trades.
On a final note, entering stop and reverse trades require psychological discipline. You have to not only admit you were wrong on the original trade, you have to also be immediately prepared to make money on the other side. Nobody said trading was easy!
Forex Pin Bar Trading Strategies
The real-world examples of using pin bars to trade profitably that I have shown in this article are based upon identifying pin bars which are rejecting (reversing from) a key support or resistance level that has already been identified. This is a well-known strategy because it can be highly effective, getting you into a trade right at the beginning of a new directional move, allowing for a good, high reward to risk ratio between your profit and stop loss.
Pin Bar Reversal at Support or Resistance Strategy
This pin bar trading strategy can be executed just by drawing anticipated support and resistance levels on a price chart and waiting for the price to arrive there, then watching for a pin bar to form that rejects the key level. You can enter at the market price as the candle closes, or you can set a stop entry order just above the high or low of the candlestick, while placing your stop loss the other side of the candle. Some traders like to place the stop loss even more tightly based upon the size of the pin bar or the average true range (ATR) of some number of recent candles. Trades can be exited for profit after reaching the next major support or resistance level, or based upon price action, or some combination of the two.
The biggest question you will probably have when trading this pin bar trading strategy is how to identify a “good” pin bar when it forms. One of the best easy ways to tell is if the pin bar is significantly larger in range than any of the five recent previous candles. If the pin bar is generally large compared to any measure of recent volatility, this is a good sign that it is more likely to be the kind of pin bar that starts an important price reversal. Another thing which can make you more confident is if the open and close are both very close to the top (or bottom, if it is making a bearish reversal) of the bar’s price range.
Pin Bar Reversal Without Support or Resistance Strategy
You can trade the pin bar reversal strategy I have just described, but the pin bars do not necessarily need to be rejecting defined support or resistance levels. If the pin bar forms in a price area which has not been reached for a long time, and the pin bar looks strong, you could still enter and hope it is the start of a major reversal.
The effectiveness of this pin bar reversal without support or resistance strategy can be demonstrated by back test data. Let us examine the price history of the two most widely traded Forex currency pairs, the EUR/USD, and the USD/JPY, since 2001. We will identify any daily pin bars, assume a trade entry when the bar closes, and assume a trade exit one day later. We define a pin bar as a bar on the daily chart which is larger than any of the five previous daily bars, with both the open and close within the bottom third of the range (in the case of a rejection of a 50-day high price), or with both the open and close within the top third of the range (in the case of a rejection of a 50-day low price). One final extra criterion is that a bullish pin bar must have a close higher than its open, and that a bearish pin bar must have a close lower than its open.
The result of the back test conducted from January 2001 and October 2020 were as follows:

We can see that although these pin bars set up very rarely on daily charts, they have a profitable record after one day during the back test, with the price moving in the average trade’s favor over the next day by 0.14%. the performance of the EUR/USD currency pair was notably better than the USD/JPY pair.
Final Thoughts
Pin bars / candlesticks can be excellent single candlestick indicators of a price reversal when they have an unusually large range, i.e. when they are larger than any recent price bars / candlesticks.
Using pin bars / candlesticks to define the beginning of price reversals can be an especially powerful method when they are rejecting defined support or resistance levels.
It is important not to put too much weight on those pin bars / candlesticks which are relatively small, as these tend to have no predictive power.
FAQs
What is a pin bar in Forex?
Pin bars can best be defined as bars or candlesticks where the open and close of the candle are both in either the top or bottom third of the candle’s price range, leaving the candlestick with an elongated “tail” or “shadow”.
What does a bullish pin bar mean?
Bullish pin bars occur where the open and close of the candle are both in the top third of the bar’s price range, with a large lower “tail” or “wick”. If the bar is relatively large compared to the previous bars, it indicates that the price is more likely to move up than down over the short term, indicating a good trading opportunity.
How do you use the pin bar in Forex?
The best way to use the pin bar in Forex is wait for a reversal pin bar to form at a price extreme, then enter a trade in the direction of the reversal. The usual practice is to place a hard stop loss just the other side of the pin bar, and hope the bar indicated a trend reversal.
How do you predict trend reversal?
The most reliable way to predict trend reversal is to watch price action and identify a change from a sequence of higher lows and highs to a new sequence of lower lows and highs, or vice versa.
