Bearish View
- Sell the BTC/USD pair and set a take-profit at 99,000.
- Add a stop-loss at 105,000.
- Timeline: 1-2 days.
Bullish View
- Set a buy-stop at 103,000 and a take-profit at 108,000.
- Add a stop-loss at 100,000.
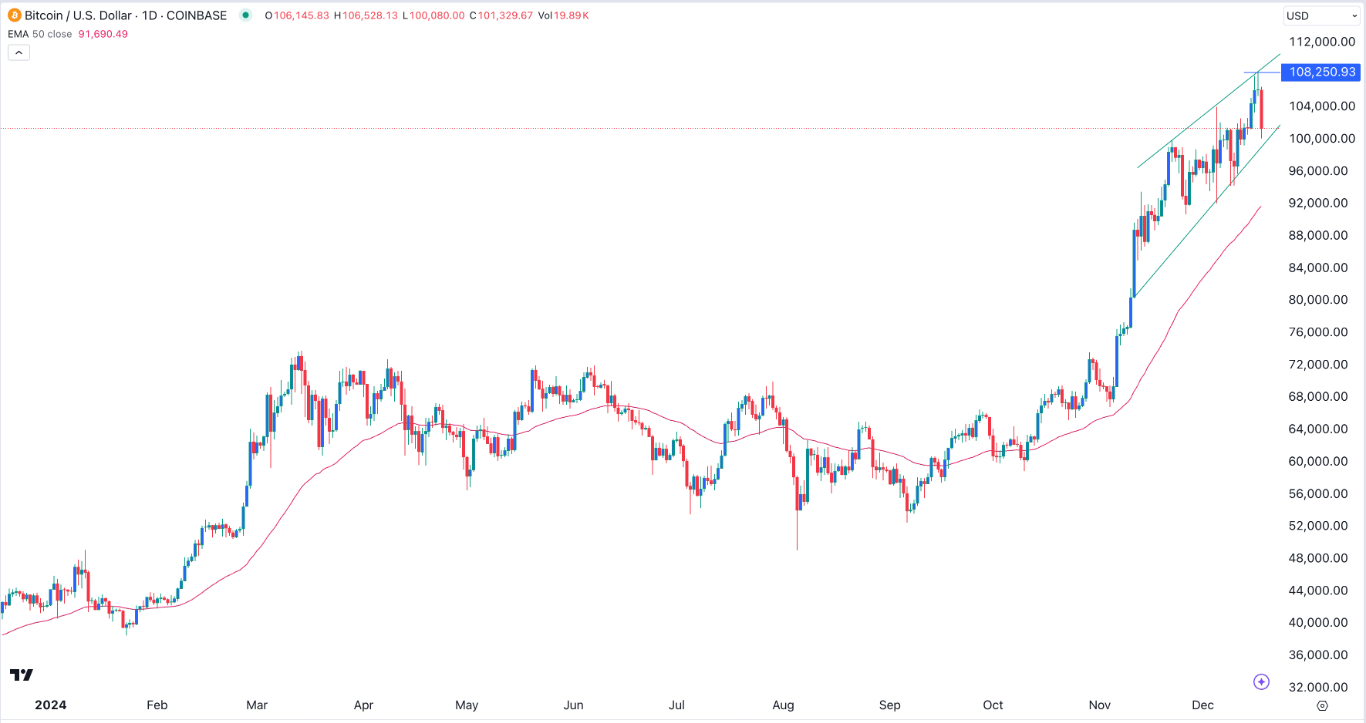
The BTC/USD pair rally took a breather after forming a doji candlestick pattern and a rising wedge on the daily chart. Bitcoin remained stuck below $101,000 after the recent strong rally took a breather, with some traders taking profits.
Top Forex Brokers
Bitcoin’s pullback happened even as the coin continued to have strong fundamentals. The most important one is the ongoing ETF inflows. Spot Bitcoin ETFs have had strong net inflows in each trading session since November 27. Total inflows have risen to over $36.7 billion, bringing the total assets under management to over $121 billion.
Blackrock’s ETF has become the biggest player in the industry with over $58.57 billion in assets. It is followed by Grayscale’s GBTC, which has $22.3 billion, and Fidelity’s $ 22.16 billion in assets. These assets will likely continue rising as demand rises.
The BTC/USD pair also retreated after the Federal Reserve interest rate decision. As was widely expected, the bank decided to cut interest rates by 0.25%, bringing the year-to-date cuts to 1%.
The bank also hinted that future rate cuts will come, albeit in a gradual pace. The bank is concerned that the labor market, with inflation rising to 4.2% in November. It is also worried about inflation, which has remained above the 2% target rate.
BTC/USD Technical Analysis
The daily chart shows that the BTC/USD pair has been in an uptrend, and recently hit the crucial resistance level at 100,000. It has formed an ascending channel, which looks like a rising wedge pattern, a popular bearish sign.
Bitcoin also formed a small doji candlestick pattern, which is a reversal sign. This pattern is made up of a very small body and an upper and lower shadow, implying that it opened and closed the session at the same price. The formation of a doji often leads to more downside.
The BTC/USD pair has remained above the 50-day moving average, a sign that the bullish sign. Therefore, there is a likelihood that the pair will have a brief pullback and possibly retest the support at 99,000 and then resume the uptrend.
More upside will be confirmed if the BTC/USD pair rises above the year-to-date high of 108,250. The pair will then rise to the next key resistance at 110,000 if this happens.
Ready to trade our free Forex signals on Bitcoin? Here’s our list of the best crypto brokers worth looking at.


