Bearish View
- Sell the GBP/USD pair and set a take-profit at 1.2650.
- Add a stop-loss at 1.2850.
- Timeline: 1-2 days.
Bullish View
- Set a buy-stop at 1.2765 and a take-profit at 1.2850.
- Add a stop-loss at 1.2650.
The GBP/USD exchange rate held steady as the focus shifted to the upcoming US inflation data and next week’s Fed and BoE decisions. The pair rose to a high of 1.2800, up by 2.5% from its lowest level last month.
Top Forex Brokers
US Inflation Data Ahead
The GBP/USD pair rose slightly after the US released mixed jobs numbers on Friday. The report by the Bureau of Labor Statistics (BLS) showed that the economy created over 200k jobs in November. Wage growth continued during the month.
However, other parts of the labor market showed that the labor participation rate dropped, while the unemployment rate rose to 4.2%. Therefore, these numbers alone may push the Fed to cut interest rates in its meeting next week.
Odds of these cuts will rise when the US publishes the next inflation numbers on Wednesday. Economists expect the data to show that the headline and core inflation remained at an elevated level in November.
The headline Consumer Price Index (CPI) is expected to rise to 2.7%, while the core figure will remain unchanged at 3.3%. If these numbers are correct, they will mean that the Fed may not cut rates next week.
The Bank of England, on the other hand, has hinted that it will maintain a dovish tone if inflation continues falling. In a statement last week, Andrew Bailey, the bank’s governor, hinted that the bank would deliver four cuts in 2025 if inflation remains low. If this happens, these cuts will bring the total cuts to 3.75%.
The key GBP-related data to watch this week will come out on Friday when the Office of National Statistics (ONS) will release the upcoming GDP, manufacturing, and industrial production data.
GBP/USD Technical Analysis
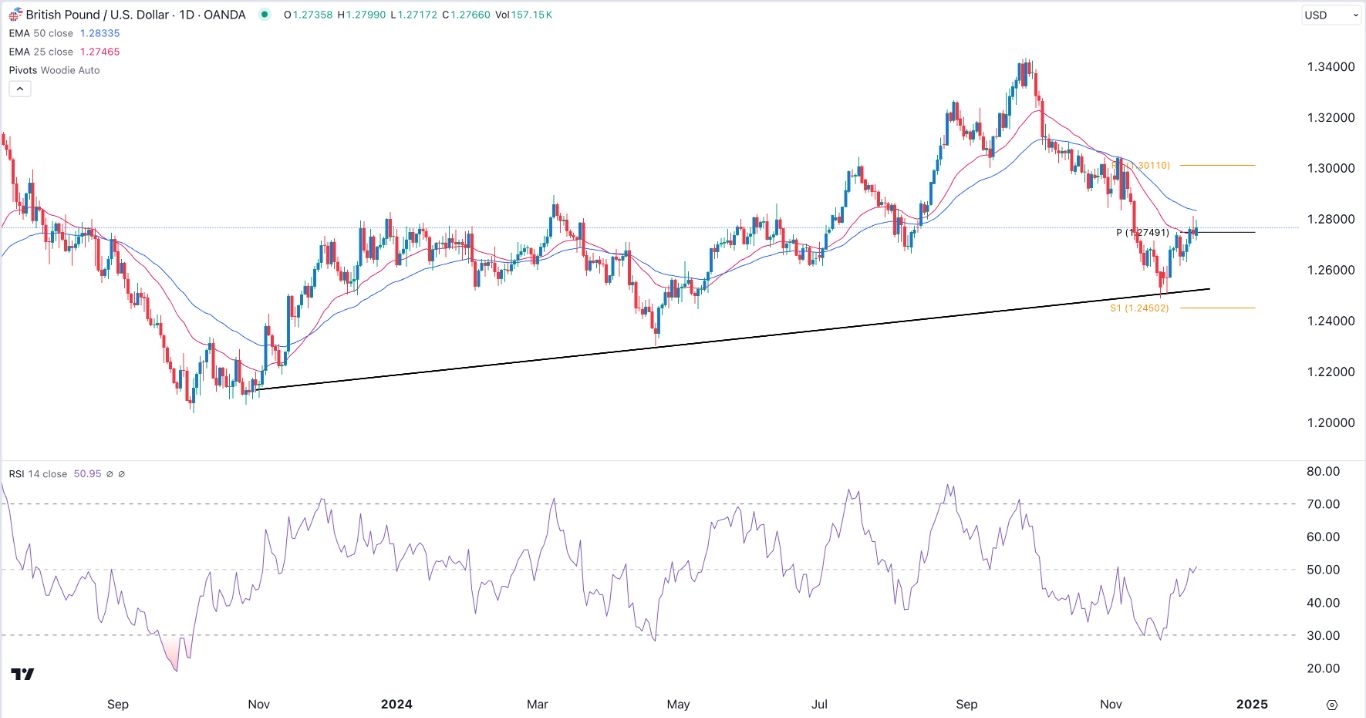
the GBP/USD exchange rate has crawled back in the past few days. This rebound happened after it dropped to a low of 1.2513, which coincided with the ascending trendline that connects the lowest level since November last year.
The pair has moved to the Woodie pivot point and the 25-day Exponential Moving Average (EMA). It remains below the 50-day EMA and has formed a rising wedge chart pattern, a popular bearish sign. The Relative Strength Index (RSI) has pointed upwards to 50.
The pair will likely resume the downtrend, and possibly retest the support at 1.2650. A move above the 50-day MA at 1.2835 will invalidate the bearish view.
Ready to trade our free trading signals? We’ve made a list of the best UK forex brokers worth using.

