Trend lines are fairly graphical representations of Forex price behavior that guide Forex traders’ decisions to buy, sell or even issue a stop order in trading. Rooted in the Dow Theory, market prices always indicate a ‘trend’ after discounting several factors such as the political environment that affect it. Thus, trend line analysis only studies the price behavior based on this presumption. Price movements exhibit 3 different trends i.e. Upward trend, Downward trend and a Reversal trend.
Upward trend
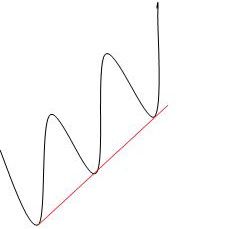
An upward trend line may be drawn by adjoining two successive price lows and can be validated to be a price trend if more than 2 successive lowest lows can be adjoined by a straight line. In simple words, the trend line will always be drawn underneath the geometric patterns exhibited by price movements on a trading chart.
 |  |
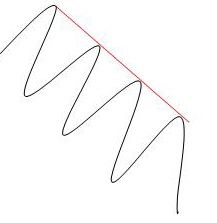
| Figure 1: Upward Trend | Figure 2: Downward Trend |
Downward trend
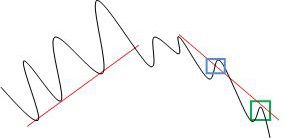
Similarly, a downward trend line can be drawn by adjoining two and more consecutive highest highs of the price movement. Here, the trend line will be drawn above the geometric patterns exhibited by price movements connecting each price high. (Ref. Fig.2). When a particular trend line breaks into a new direction, it indicates a trend reversal. (Ref. Fig. 3). Simply put, in the figure below, an upward trend line will reverse the moment the price behavior pattern lies below the trend line (notice green box). However a trend reversal is not always necessarily an indication from the trend line when it merely pierces through a price pattern (notice blue box).

Figure 3: Trend Reversal
Furthermore, in certain cases the market price exhibits a sideways trend i.e. when the price tends to neither rise nor fall intensively resulting in the geographic patterns channeled on a horizontal line.
Support & Resistance in a trend line
In the case of an upward trend, the trend line will indicate a support force owing to the rising demand while even the prices rise, spurred by precedented market price behavior. Every successive upward move of the trend line acts as a support until the point where the trend line is broken which is when the market price becomes resistance. The moment the trend line shows a descending trend, it triggers massive selling of the underlying currency pair and the increasing supply makes the market bearish.
Trend lines assist traders extensively in deciding, timing and executing their trade while also minimizing risks if these are charted right. A trader ideally buys at the point of a dip in prices during an upward trend i.e. when the prices touch the trend line and engages in selling when the price movement patterns rise in a downward trend. Trend line analysis is also instrumental to identifying and planning entry or exit points in a particular trade by making calculated guesses around the price action exhibited on and around the trend line.
Trend line analysis however suffers from the standpoint of time since a trader needs to be able to assimilate immediate, medium-term and long term price movement trends to be able to make a justifiably accurate trading decision. An intra-day price chart may indicate a different price action trend than a daily or even a weekly price action chart. However, in practice it has been observed that taking into account the immediate and medium-term trends allow traders to choose the right action. Trend line analysis has become a necessity in forex and technical analysis for obvious reasons. However, experienced traders hone themselves gradually to undertake trend line analysis instinctively in their mind by merely looking at a price action chart.
What it is a trend line
The Forex trend line is the most basic and yet the most valuable technical analysis tool available. Everybody uses it. It is the basis for all other analysis. The simplicity of it and the obviousness of it are what makes it a standard seen on just about every chart in Forex. All it takes is a few reversals and the ability to draw a straight line. Every live chart on the Internet using a Java application avails itself to this technique with a click of the mouse. The Forex trend line is sometimes recognizable even without the use of a line.
If the market is moving in an upward direction, but has at least two progressive swing points, the line that you can draw underneath those swing points is considered a legitimate Forex trend line. It shows you where the support is and lets you predict where the next level of Forex support may be. On the opposite side of the coin, if the Forex market is moving in a downward direction, connecting those swing points above them will give you areas and points of resistance on a bearish Forex trend line; not only past and present, but future as well. These will serve as your entrance points into the market.
Then there's the horizontal move. It makes no difference as far as the Forex trend line is concerned, therefore there should always be a Forex market to trade. Connecting the swing points, like connecting the dots, are going to give the Forex trader a complete picture of the Forex market where it is in the present and give him the probability of where it is going.
Trading range
The Forex trend line doesn't only involve one line (although it can). If the Forex trader takes the bottom points of the swing points and draws a line, and then takes the top points of the swing points and draws a line; the chart immediately gives you a trading range. You have right there a support level and a resistance level. You have a predicted entrance point and an exit point. With the addition of another line or two, the chart will also give the Forex trader a place to insert the stop-loss.
When the Forex market breaks out of a particular trading range it gives an opportunity to a whole new set of lines. The resistance becomes the support (if the market is going up) or the support becomes the resistance (if the market is on a downturn). If you want to create a new trading range from there, a new Forex trend line will have to be drawn depending on the situation and the amount of swing points available.
Intersecting lines
The Forex trading range doesn't always run in parallel lines. Oftentimes the lines will narrow and intersect. Therefore, when this happens a possible trading range will be lessened and the chances of a breakout will occur. At the point of intersect the Forex market has to be watched closely because that particularly is usually important in the realm of a new support or resistance. The Forex trend line is the foundation of everything Forex. Pay attention to it.
Summary
In summary, trend lines are an excellent way to take a ‘macro’ look at the general direction of a forex contract. They are relatively simple to draw as well as to interpret and are used relatively frequently by novice and expert traders alike. The use of trend lines also supports the use of supports and resistances.
