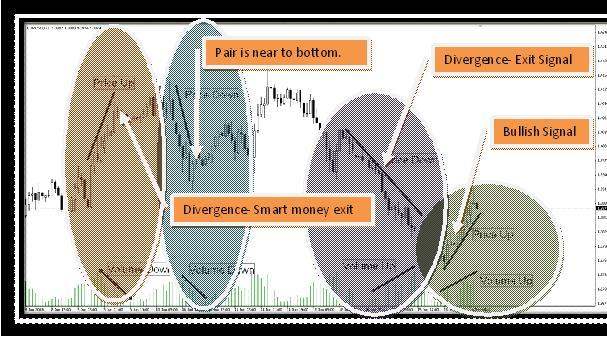
Price and Volume are the basic raw materials of the chart. Volume is a technical tool which is very important for analyzing the movement of the prices. Volume relates to the mass (traders or investors) which helps in determining whether price movements are strong or weak. For instance, if a buyer buys one share from the seller then this adds one to the volume.
Top Forex Brokers
Combined study of price and volume gives the true picture of the pairs which shows what others are doing and thinking. It also helps in understanding the psychology of the market. Four possible situations which occurred in price-volume analysis are as follows:
| Price | Volume | Interpretation |
| Up | Up | Market is in an uptrend |
| Up | Down | Divergence in the pair as price is moving up and on the other hand, volume is going down. Traders can exit at this situation. |
| Down | Up | Price is going up but the volume is falling. It indicates that more and more traders want to exit from the pair. |
| Down | Down | This is showing the bearish trend but this is an early indication which means that the market is near its bottom. |
1. Price Up and Volume Up
– Price up and volume up is the bullish signal for the market (or pair). It shows the market is in an uptrend and more and more traders want to enter in the pair.
2. Price Up and Volume Down
– Price up and volume down is a dangerous situation for the market as well as for the inexperienced trader where the distribution is done by the smart investors who have some inside information about the market. Price and volume analysis is very helpful at this point which shows the clear divergence as we can see in figure 1 where price is moving up but volume is not supporting the up movement giving the early signal of smart money exit.
3. Price Down and Volume UP
– This is the situation where nobody wants to continue with their long position and wants to exit from the pair. This is the divergence point where price moves down and the volume goes up.
4. Price Down and Volume Down
– Price down and volume down is the market situation where the market is near its bottom.
In technical analysis, there are so many volume based indicators used by forex traders:
a)
OBV
– OBV is the very basic indicator which indicates the activity of bulls and bears in the market. When OBV moves up, it means volumes are higher which refers to the bullish signal and, when OBV moves down then this is the bearish signal. Formula
• if today’s close> yesterday’s close Formula =Yesterday’s OBV + Today’s volume
• If today’s close< yesterday’s close Formula =Yesterday’s OBV - Today’s volume
b)
Volume Accumulation
The volume accumulation indicator shows the strength of conviction behind a trend. With the help of this indicator, it is easy to find the small divergence in the pair. Formula = Volume *

Key takeaways
Price and volume analysis is the basic understanding of the market which tells the trend of the market and gives an early signal (like divergence).There are four possible situations in price and volume analysis, they are: a) Price up – Volume up, b) Price up – Volume down, c) Price down – Volume up, d) Price down – Volume up.
