What is the Evening Star Candlestick Pattern?
How to identify an evening star on a Forex price chart?
The bearish evening star is a three-candlestick pattern that has a long & bullish candlestick for the first candle, followed by a gap higher on the second candlestick that also has a very small range. This is said to represent a star in the sky that is signaling it is nighttime, therefore bearish. The third candlestick is a gap lower, and a longer candlestick.
How the evening star candlestick pattern works: by the time this pattern is formed you will see a gap higher, followed by a gap lower and extreme selling pressure. This suggests that the buyers have been blown out, offering more downward pressure than anything else. This often signifies a significant selloff just waiting to happen. While most people look at this as a candlestick pattern that should be at a swing high, it can be found anywhere on a chart.
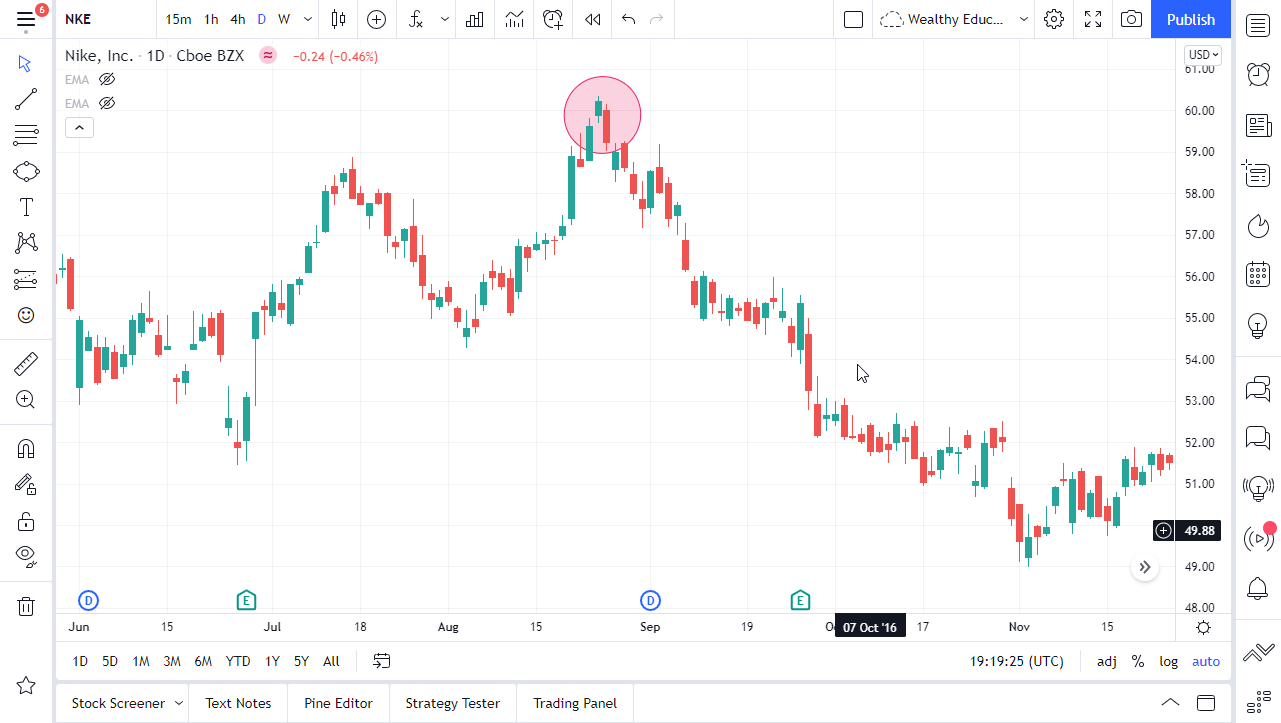
For an example of the evening star candlestick pattern, examine the below chart of Nike stock. In the highlighted area, you can see that the market had been in an uptrend, gapped higher to form a short candlestick, and then gapped lower on the third day to show signs of exhaustion. Most traders will short this set up on a break below the bottom of the lowest of the three candlesticks, with a stop loss at the top of the star (the middle candlestick) itself. While some purists suggest that the “star” must be a doji, the reality is that the star just needs to be smaller than the other two candlesticks, showing a slowing of momentum.
What is a Morning Star Pattern?
As with most candlestick patterns, there is also an inverse version. The “morning star” is the exact opposite of the evening star, with a long bearish candlestick, a gap, and then another gap that produces a long bullish candlestick. In other words, the exact opposite, so this pattern is bullish. The idea is that the sun is rising, and it should bring in light, or bullish pressure. These of course are based upon descriptions of ancient Japanese candlestick charts.
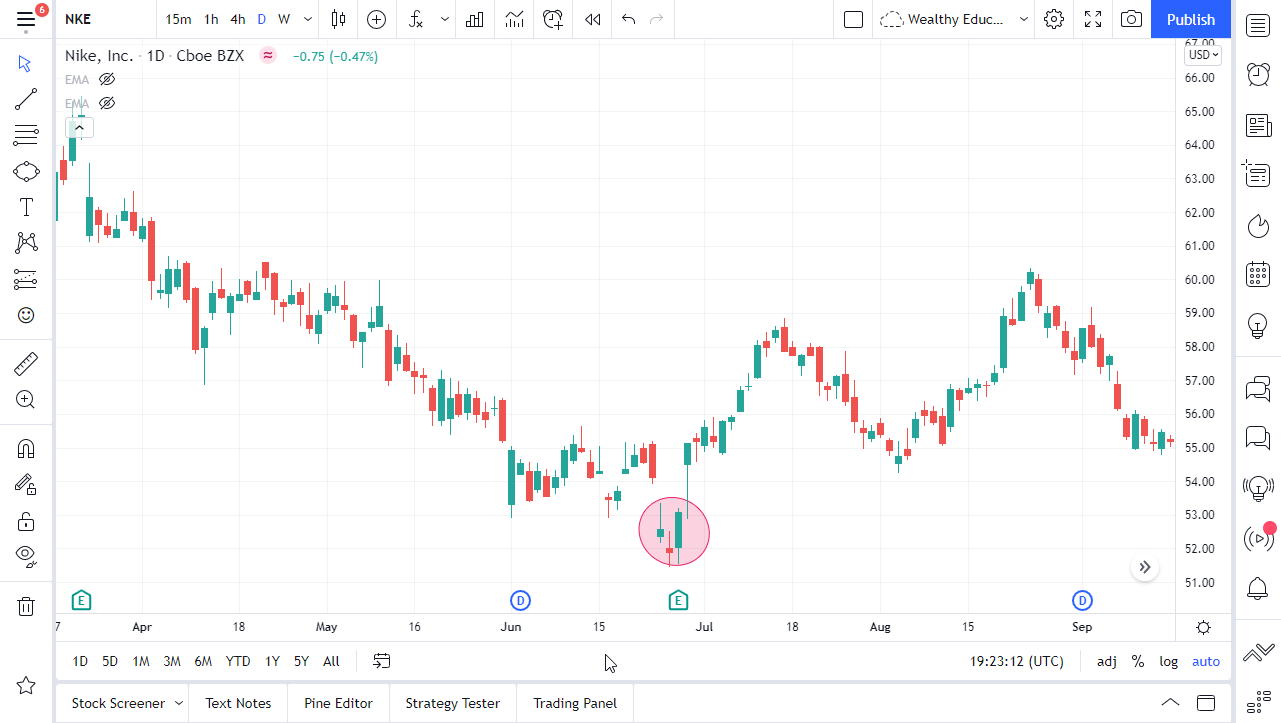
The usual way to trade this pattern is simply by buying on a break of the highest of the two long candlesticks, with a stop loss being placed below the bottom of the star. I have picked out another example below using Nike stock, because it shows multiple reasons to think that the pattern will work. Not only do you have the pattern itself, but you also have the first candlestick which ended up being an “inverted hammer” and breaking above the top of that wick itself was a good signal to go long. You can see that the market took off from that point as we gapped higher, pulled back to fill that gap, and then turned around to race towards the $59 level.
Evening Star and Morning Star Patterns in Forex
It should be noted that most of the time you see an evening star pattern in Forex, it will be on the weekly time frame. This very rarely happens, so it is obviously a very strong sign when it does.
This means that the evening star pattern is quite reliable in Forex when it forms on the weekly chart. Some exotic pairs can form these candlesticks a little more easily than others, for example the Russian ruble which does not necessarily trade 24 hours a day, depending on the broker. That is another massive issue with trading this candlestick pattern in the Forex markets, because not all brokers keep the same hours. In other words, your feed may show one of these patterns, but it might only be because the exotic currency trades only during a limited period. Therefore, the pattern is generally not recommended to be traded in currency pairs on the daily chart.
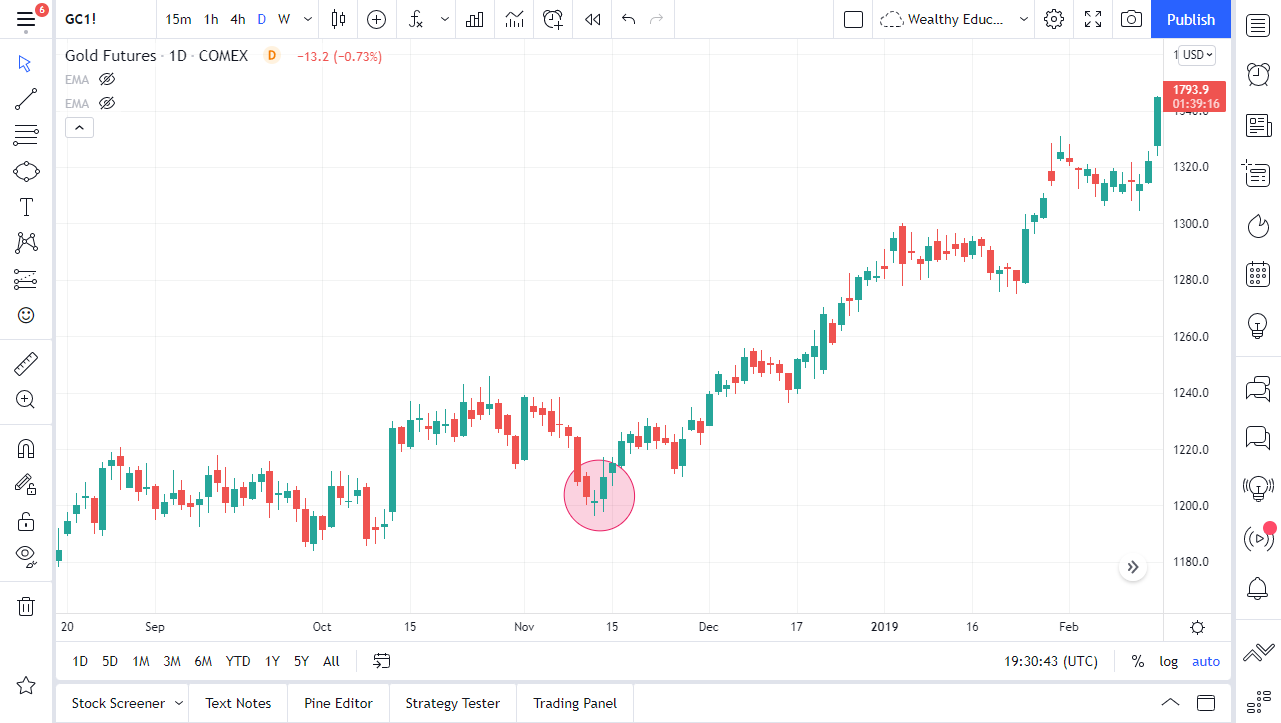
You can use these patterns in other, non-Forex markets that close on a daily timeframe. For example, futures markets do close for about an hour per day, sometimes more depending on the market. In this scenario, this candlestick pattern can form. Check out the example below, it is a gold futures market chart that features a morning star pattern, which is highlighted.
Evening Star Candlestick Trading - Pros & Cons
- Reversal Signal: It provides a strong bearish reversal signal, indicating a potential trend reversal from bullish to bearish.
- Clear Pattern: The evening star pattern is relatively easy to identify on price charts, making it accessible to traders.
- Confirmation: When combined with other technical indicators or chart patterns, it can enhance the reliability of the reversal signal.
- Not Always Accurate: Like all technical patterns, the evening star is not foolproof and can produce false signals, leading to losses.
- Subjectivity: Interpretation of the pattern can vary among traders, leading to inconsistencies in trading decisions.
- Market Volatility: In highly volatile markets, the evening star pattern may be less reliable as sudden price swings can disrupt its effectiveness.
Bottom Line
Depending on the market you are trading, these patterns do tend to be very useful. After all, you need to keep in mind that there had to be something to make the market gap higher, then lower, or vice versa. In other words, as soon as one side of the market gained ground, the other side came back and took it away from them. That is a very powerful signal because it shows a sudden shift in attitude of the course of just a couple of days. While this is a very rare pattern in the currency markets, they do tend to work very well in the stock commodities markets, because these markets are generally less liquid than Forex.
FAQs
How do you trade the evening star candlestick pattern?
On an evening star pattern, you short the market at the lowest of the two longer candlesticks. The center candlestick, the star, is where you place your stop loss above. For the morning star pattern, you enter the trade on a break above the higher point of the first and third candlestick, putting a stop loss below the middle candlestick.
What are morning star and evening star candles?
These candlesticks are simply a small candlestick between two conflicting and long candlesticks. For example, if you get a long bullish candlestick, a short candlestick in the middle, and a long bearish candlestick, that short candlestick is the evening star. As for the morning star, it is a long bearish candlestick that is followed by a short candlestick, and then followed by a long bullish candlestick. The morning star is the center candle in that scenario.
What is a doji?
A doji is a candlestick that is neutral, with little or no real body. These candlesticks can signify potential exhaustion at over-extended levels or support and resistance, but by themselves aren’t particularly meaningful.
What is a tweezer top in Forex?
The tweezer top candlestick pattern in Forex is seen whenever there are two similar candlesticks making a high with long upper wicks rejecting the high. These candlesticks are called “tweezers” because they look like tweezers.
Is the evening star a reversal pattern?
Yes, the evening star is a bearish reversal pattern in candlestick charting. It usually occurs at the end of an uptrend and suggests a potential trend reversal from bullish to bearish.
Is the evening star bullish?
No, the evening star is not a bullish pattern; it's a bearish reversal pattern. It signals a potential shift from a bullish trend to a bearish one
How accurate is the evening star pattern?
On its own, the evening star pattern is not accurate at all, but it can be a more accurate signal when it is confluent with other technical factors pointing in the same direction, for example a key support or resistance level is rejected for a reversal, or when there is a long-term trend in the direction of the evening star pattern’s reversal.
What is the significance of the evening star?
The evening star chart pattern suggests that an upwards price movement may be about to reverse. This can be a good signal to exit a long trade or to enter a new short trade.
What is the position of the evening star?
The evening star is a three-candlestick price chart pattern positioned at the top of an upwards price movement.
What is the evening star in a downtrend?
In a downtrend, the inverted evening star pattern is called a morning star, and it is suggestive that a bullish reversal may be taking place.


