One of the most frustrating things to deal with in Forex trading is the “fakeout” – a common name for a breakout which does not only fail but produces a significant move in the other direction. In this article, I’ll explain with examples what to do when a breakout fails.
The problem with breakouts or breakdowns is that there is no guarantee that it will continue to move in the direction of the initial momentum. In fact, this is probably one of the most dangerous issues to deal with, because even though the trader may believe that they have done everything the correct way, the market simply moves against them after the breakout happens. It is very important to remember that most breakouts fail, but breakout trading can still be one of the most profitable trading strategies as the few winners can produce much bigger wins than the average loser.
Therefore, to psychologically handle failed breakouts or fakeouts in Forex, you need to understand that there is a certain amount of randomness and luck when it comes to trading Forex. While most gurus will tell you about a perfect system or how there is some type of “holy grail strategy” out there, the reality is that anything can happen at any time. Quite frankly, there have been studies done that simply entering the market on a random “buy/sell” type of attitude can produce results, depending on how you handle your trade management. In any case, most breakouts in Forex fail and any breakout trading strategy must accommodate that fact.
When breakouts fail, many new traders devolve into “revenge trading”, meaning that they place a trade in the opposite direction but with a larger position size to compensate for the previous loss. This can be very dangerous, both financially and psychologically.
If you are going to trade a “fakeout”, i.e., a failed breakout, you need a way to make sure that the breakout has not only failed – this is normal – but that it has failed so spectacularly and strongly that it looks to now be producing very strong momentum in the other direction.
If you trade every failed breakout in the other direction, you will only be doubling up on your losses.
To show you the differences between successful breakouts, failed breakouts, and fakeouts, I have put together a few illustrated examples below.
Breakouts and Fakeouts in Trendlines and Chart Patterns
New Forex traders typically learn technical analysis and focus solely on technical aspects of price charts like trendlines and chart patterns. While these can work enough to be profitable over the longer term, the reality is that nothing is 100% guaranteed in Forex. For example, a trendline will eventually get broken, otherwise there would be no such thing as a trend change. When traders enter a new trade based on a trend line, they too often just assume that the trend line will hold indefinitely. This is a shame, as trend lines can be subjective and unequal: some trend lines tend to be more reliable than others.
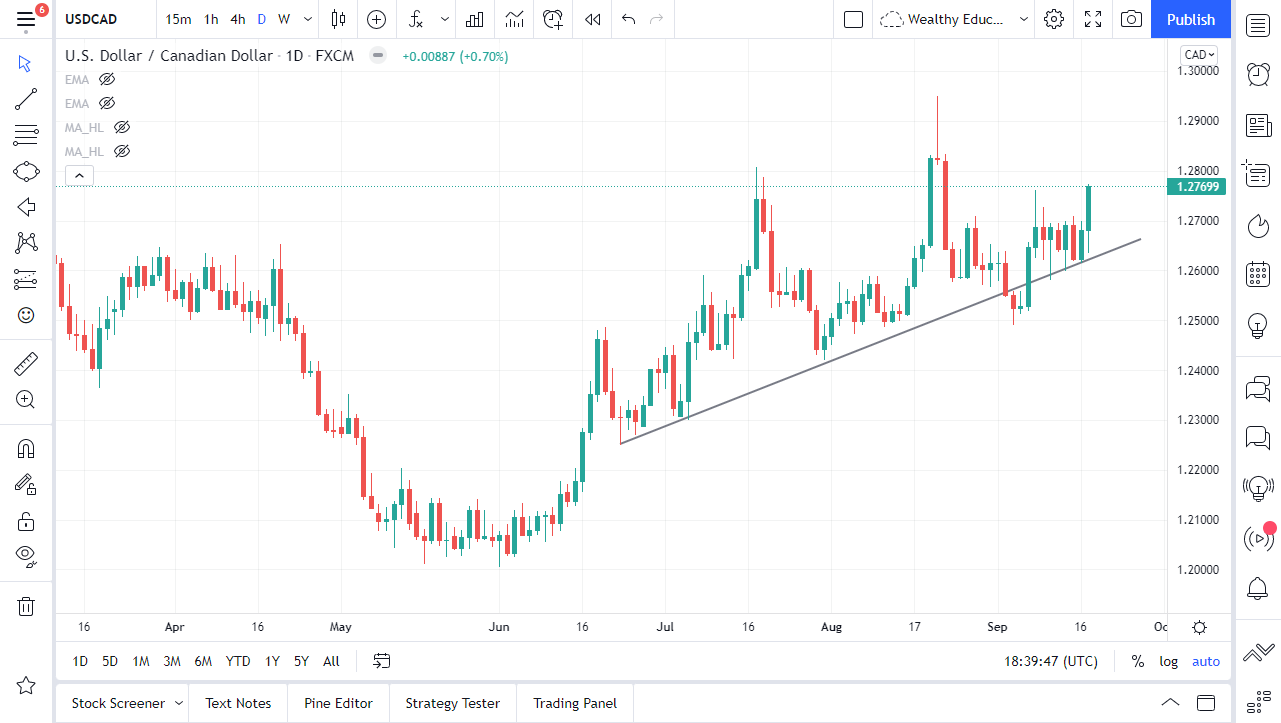
Check out the price chart of the USD/CAD currency pair shown below. There had been a relatively reliable uptrend line for several months, but there were a few days in early September when the currency pair broke below the uptrend line. A few days later, we saw an impulsive move back above that trendline which then started to offer good support again. For those who had shorted the market on the failed bearish breakdown, this must have been very frustrating as during the first two days following the breakout, it looked like the short trade was going to work out. Having said that, once the impulsive candlestick formed after the false breakout, there should have been no question that it was time to get out. This strong candlestick could also have been used as evidence that the bearish breakdown was not just failing but was a valid fakeout warranting a long trade as a reversal in the other direction.

Fakeout from Trendline
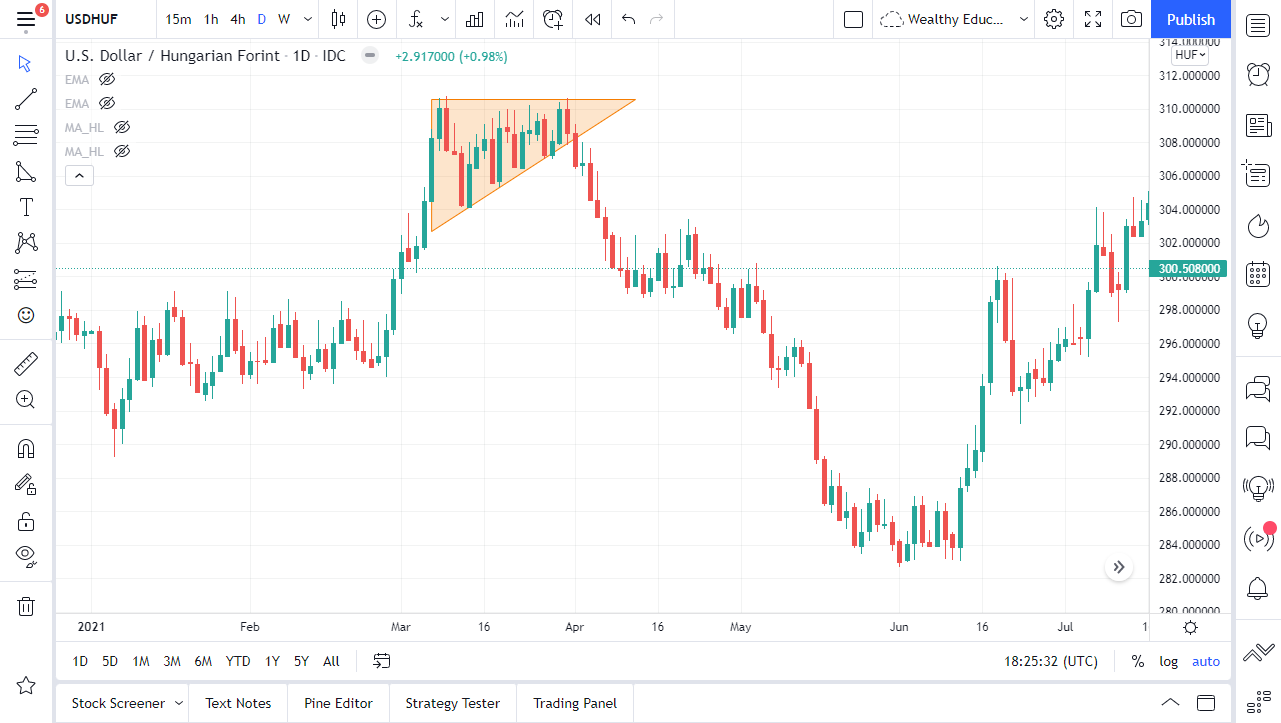
Another example is the following one in the Hungarian forint / US Dollar exotic currency pair. As you can see, I have marked an ascending triangle pattern within the chart, something that a lot of traders would be paying close attention to as the price approached the key breakout level at 311 HUF. However, the successful breakout finally came in the opposite direction of what was generally expected, although the market had broken through resistance levels twice, but finally fell rather hard as the selling increased, triggering a successful breakdown below the pattern.

Surprise Breakdown from Pattern Formation
Stop Losses in Fakeout Trading
When you do trade a fakeout, where should you place your stop loss? Frankly, it depends on the pattern or reason that you are taking the fakeout trade. In any case, the distance between your entry point and your stop loss needs to be much smaller than the distance between your entry point and your profit target (whether hard or provisional). Additionally, you must understand that just because a breakout fails in Forex does not necessarily mean that you should trade in the other direction. It simply means that the market was not ready to move with momentum in the direction of the breakout. You should only be prepared to reverse and trade the fakeout when a breakout fails spectacularly with very strong momentum.
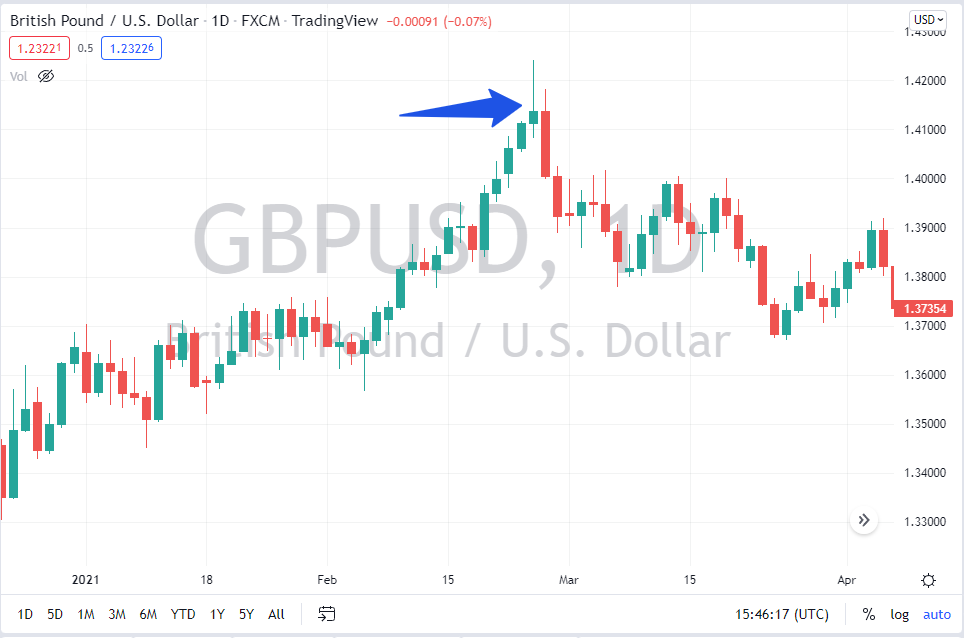
In the following chart, which is the same price chart was shown earlier, I have circled a shooting star candlestick pattern. The price initially broke down below the bottom of the bearish shooting star candlestick, only to turn around and break higher again. Your stop loss typically on a shooting star is the top of the candlestick, so therefore once that happened, you needed to take a loss. You could call this a valid fakeout, as it was a bearish breakdown that failed quickly and strongly and going long when the initial breakdown short trade stop loss was triggered could have netted you some profit. Another factor adding value to such a long trade would have been the fact that it was in line directionally with the longer-term bullish trend.

Fakeout from Shooting Star Candlestick
The Power of the Fakeout Pattern
I mentioned earlier that not every failed Forex breakout is a good reason to enter a second trade in the opposite direction. Where it is worthwhile trading as a fakeout is where the failure is strong and spectacular, also if the failure is in line with a longer-term trend. Another thing worth paying attention to is whether the failure is at a truly key support or resistance level. If the price is sitting at a major support or resistance level, and the price breaks out beyond it only to quickly turn around and go in the other direction, that is something worth paying attention to. For example, if there is a specific resistance barrier that the market has not been able to get above for several months, but suddenly does get above there for just a short amount of time before pulling back into the previous price action, that can tell you where the market does not want to go. This can be crucial information.
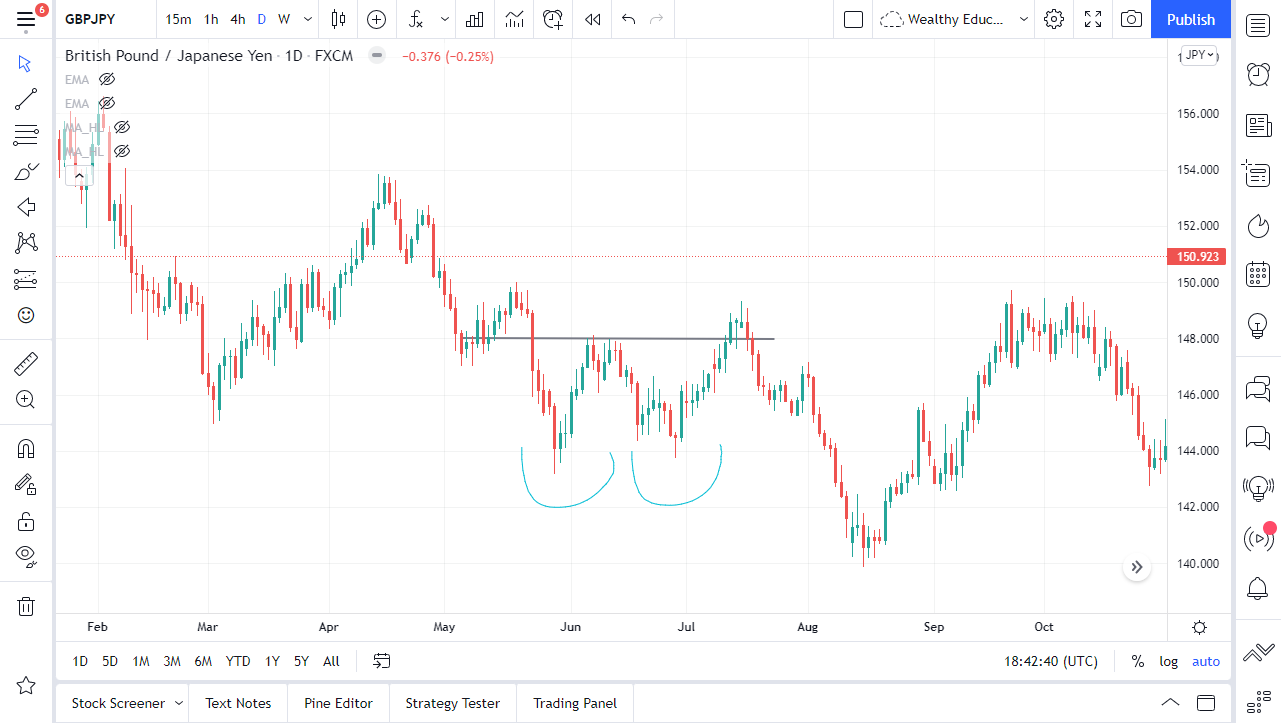
Check out the GBP/JPY price chart shown below.

Fakeout from Double Bottom Pattern
We have a bit of a “double bottom”, or even a “W pattern” that is highlighted on the chart. You could make the argument that the “W pattern” might have been defined at ¥148 or ¥150. This confusion can cause a lot of trouble. However, there will have been a lot of traders who saw this double bottom as an opportunity to get aggressively long of this currency cross. The market initially broke out above the middle of the perceived “W pattern”, showing bullish pressure. However, once the market broke back down below the ¥148 level, that showed us the market was no longer looking very bullish. At that point, the fact that we had a bearish shooting star which began the move lower gives you an idea as to where you could place your stop loss: just above the high of the shooting star candlestick. The market then fell strongly, so this would have been a great short fakeout trade.
Final Thoughts
To be successful, traders must understand that there is a certain amount of luck in Forex trading. Good trades become losers and poor trades can be winners sometimes, and no setup is ever more than 70% certain – perhaps much less. Quite frankly, if trading were as easy as buying the market every time we broke out of a pattern, everybody would be rich. The real question is whether you can handle yourself once the market turns against you, dashing your hopes. Knowing when to get out of a losing trade and accept the loss, and when to take the loss but try again in the opposite direction because the failure is impressive, is a skill worth building in Forex trading.
If you can read the clues price sometimes gives you as to where the market is not willing to go, this is also a valuable skill. Pay attention to these levels because they do tend to be interesting when they are retested later. Where we see the market have a strongly false breakout, then you should assume that is an area that will continue to hold, at least for some time.
It is easy enough to trade breakouts but understanding fakeouts in Forex and their importance when it comes to technical analysis can give you a huge advantage over the average retail trader. It is crucial that you look at longer-term charts as part of your analysis in this area.
FAQs
What is a fakeout in Forex?
A fakeout in Forex is a failed breakout which fails quickly then produces a strong move in the other direction.
How do you know if it is a fake breakout in Forex?
Unfortunately, there is no truly straightforward way to know if it is a fake breakout until you get the market turning around and working against your initial trade. For example, if you were to enter at the 1.18 level in the EUR/USD pair, only to see the market rise and then fall below your entry price, that is the only time you can truly call it a “false breakout.” Until then, all you can do is manage your stop loss and position size.
How do you trade fakeouts in Forex?
Wait for a failed breakout at a key support or resistance level that quickly takes out your stop loss with strong momentum, and then moves even further against the direction of your initial trade. Then enter in the direction of the failure with a stop loss just beyond the highest point of the initial (failed) breakout, or lower based on volatility as measured by the average true range (ATR) indicator.
