I see triangle formations appearing on price charts more than any other chart pattern. They can give some of the best trading opportunities.
Like all things in trading, triangle trading patterns are not a magic bullet: you should not automatically buy or sell as soon as you see one. Triangles can mean different things depending on where they appear on the chart, and some triangles will be significant while others should be ignored. So, using triangles profitably means learning the details to get it right.
Top Forex Brokers
In this article, you will learn:
- The diverse types of triangle chart patterns
- How to use triangle chart patterns in your trading
Definition of a Triangle Pattern and Types
In a triangle formation, the price moves sideways but in a tighter range as time passes. Eventually, the price must break out because the range cannot become any narrower.
Triangle chart patterns are, therefore, breakout patterns. They can either continue the dominant price direction or reverse it.
There are three main types of triangle trading patterns:
- Ascending triangles
- Descending triangles
- Symmetrical triangles
All three types of triangles can be bearish or bullish. Most traders assume ascending triangles are bearish and descending triangles are bearish—but the price can break out in either direction from ascending or descending triangles. I will explore this in more detail in the article.
Wedges
A wedge is a type of chart pattern like triangles. There are two types of wedges:
- Rising wedge (bearish pattern)
- Falling wedge (bullish pattern)
Let’s look at each type of pattern in more detail.
Ascending Triangle
An ascending triangle has a horizontal resistance level with a rising support level.
It is easy to assume an ascending triangle should be bullish—it has higher lows, like an uptrend. The higher lows give the sense that the price will break through the resistance and begin a new bullish move.
Yet with an ascending triangle, the price can break out in either direction—either to the upside or to the downside. Remember, a triangle is a breakout pattern, and breakouts can happen in either direction. Pay attention to the price context when this triangle appears, to help predict how it may break out. For example, does the ascending triangle appear during a trend? Is the triangle small, indicating a pause rather than a larger reversal pattern? Then the ascending triangle will probably continue the trend, whether it is an uptrend or downtrend.
Descending Triangle
It is easy to assume a descending triangle should be bearish—it has lower highs, like an uptrend. The lower highs give the sense that the price will break through the support and begin a new bearish move.
Yet with a descending triangle, the price can break out in either direction—either to the upside or to the downside. Remember, a triangle is a breakout pattern, and breakouts can happen in either direction. Pay attention to the price context when the triangle appears to help predict how it may break out. For example, does the descending triangle appear after a bearish or bullish reversal pattern, such as a head and shoulders or inverse head and shoulders? The descending triangle could have a bullish breakout if the bigger picture or preceding price action is more bullish.
Symmetrical Triangle
A symmetrical triangle has a lowering resistance level and a rising support level, both pushing against each other to create a narrowing range.
Like ascending and descending triangles, symmetrical triangles can be bullish or bearish depending on the market conditions when it appears.
Often, traders will assume that symmetrical triangles are continuation patterns, but they can reverse the trend, especially when the triangle is larger, because that indicates a more significant battle between buyers and sellers.
Immediately before a symmetrical triangle, if you see a strong spike up in price or dive in price down that forms an almost vertical line (known as a “flagpole”), you have a pattern called a “pennant.” When this happens, the symmetrical triangle will be likely to continue the trend.
Are symmetrical triangles better? Traders often assume that symmetrical triangles are more neutral, but ascending and descending triangles can break out in either direction—to the upside or downside—so symmetrical triangles are not necessarily more neutral. But if you see a symmetrical triangle as part of a flagpole pattern, that indicates that the price will likely continue the move rather than reverse it.
Often, traders will wait for the price to break out before entering a triangle. However, if you feel confident the price will break out in a certain direction, you can enter before the breakout to get an early entry with more profit potential. This can happen when you see the “flagpole” before the triangle I described above.
Triangle Chart Patterns in Trends
What is the best market condition to trade? Most traders, including me, will say trends. But even in a trend, it is not best to just jump in at any point. The trick is to find entries in trends that give a high probability of success, and triangles provide that.
A triangle can either be a continuation or a reversal pattern. Smaller triangles are more likely to be continuation patterns—the price is pausing for a breath before continuing the trend. On the other hand, a large triangle suggests a more significant battle between buyers and sellers, which means the market is questioning the trend.
If a small triangle appears during a trend, the trend direction is what matters. The shape of the triangle (ascending, descending or symmetrical) matters less.
If you see a triangle appear during a trend, but it is large relative to the swings in the trend, then the price could either reverse or continue.
Triangles Resting Against Support or Resistance
A triangle trading pattern can sometimes “rest” against a previous support or resistance level. When this happens, I have noticed that the breakout is more likely to happen and that it is less likely to be a false breakout. It is as if the triangle shows the market taking a deep breath before pushing through decisively.
When I trade the “resting triangle” pattern, as I call it, I want to see an ascending triangle resting against resistance or a descending triangle resting against support.
Use the lower timeframe to find a triangle.
You might spot a triangle on a lower timeframe than the one most directly relevant to the support or resistance level you are viewing. For example, if a support or resistance level is visible on the daily timeframe, you might spot a resting triangle on the 1-hour or 4-hour timeframe.
Using multiple timeframes is my favourite way to trade. I start by looking for trading opportunities on larger timeframes, for example, the daily timeframe. I then drop down to a lower timeframe to execute the trade. The lower timeframe means that I trade in line with the bigger picture—this gives me a smaller stop-loss and risk with often a larger reward from the higher timeframe.
Try incorporating more than one timeframe in your analysis, whatever trading method you use.
Wedges
Wedges differ from triangles because their shape is the bigger factor determining whether they are bullish or bearish. A wedge can reverse or continue a trend.
Falling wedge: bullish
 Rising Wedge: Bearish
 For example, you may see a falling wedge during an uptrend, helping you by giving an entry before the trend continues.
 Or you may see a falling wedge helping to confirm a support level.
Tips for Trading Triangle Patterns
- Smaller triangle patterns during trends are usually continuation patterns and are one of the best ways to trade triangles.
- Larger triangles represent a greater battle between buyers and sellers and can be either continuation or reversal patterns.
- Look out for ascending triangles resting against resistance or descending triangles resting against support levels—these indicate that the price may break through the levels.
Pros & Cons of Trading Triangle Patterns
Pros
Triangle trading patterns are dependable and frequently appear on charts. If you become familiar with them, it will help you find more trading opportunities.
Cons
Triangles are discretionary and highly subject to market conditions. You should have a solid all-around knowledge of technical analysis before and not trade them blindly.
Triangle Trade Examples
Over May and June 2022, I saw the S&P 500 make a descending triangle on the 4-hour chart. I noticed that the support level of the triangle was also a prior support and resistance level. This is a good sign because it tells me the triangle is significant, and I can trust the breakout.
Also, the S&P 500 was in a longer-term downtrend.
Eventually, the price broke the support level, and it did with a solid bearish candle, which showed that the breakout was decisive. It was easy to enter a short trade after this candle. In this case, the stop loss was in the middle of the triangle.
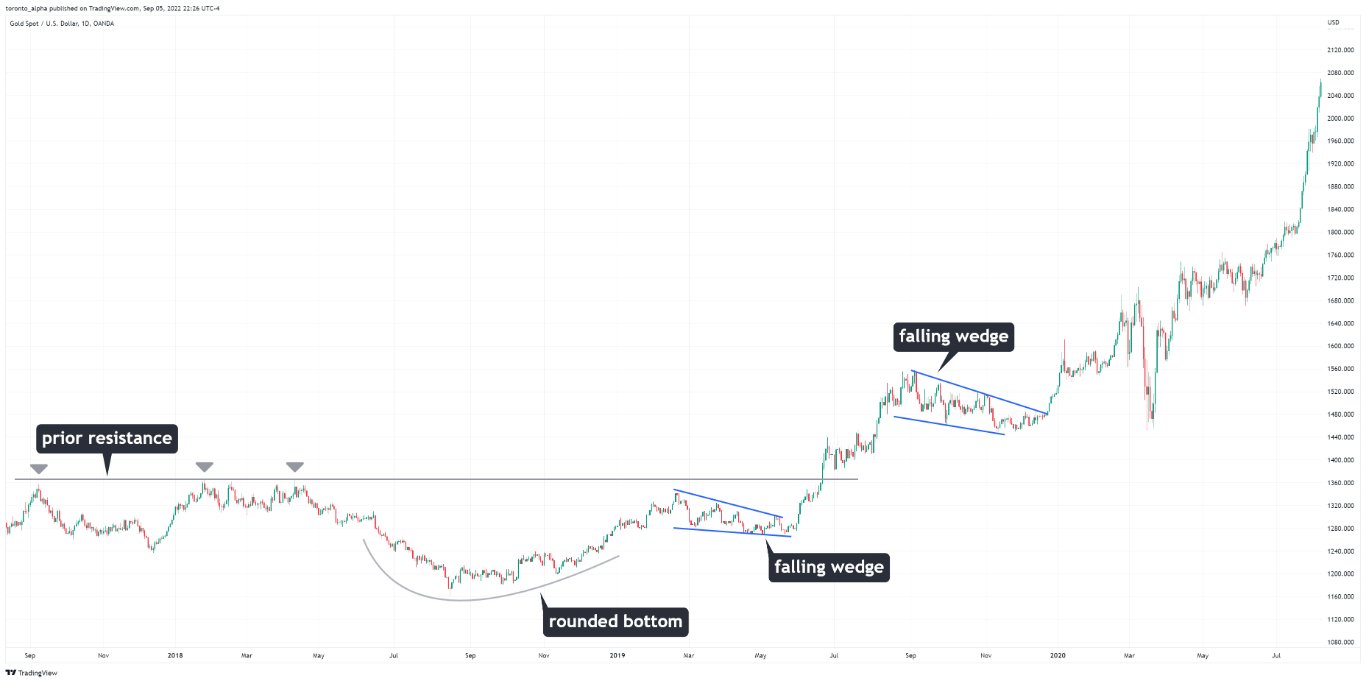
From mid-2019 to mid-2020, the price of gold began a historic uptrend as it almost doubled in value and reached new all-time highs.
As the uptrend began, two bullish falling wedges indicated the price would move up and help traders get an entry. Let’s look at both.
Falling wedge 1:
When I saw this falling wedge in real-time, I was cautious because of the previous resistance the price could hit if it broke out to the upside. But the price had also made a “rounded bottom” formation, which is a very bullish pattern. It turned out that this falling wedge marked the first stage of the historic uptrend and was an excellent opportunity for any trader that spotted it. The candle that broke through the resistance was a strong green candle, showing a decisive move. That helped confirm the falling wedge nicely.
Falling wedge 2:
The second falling wedge was an easy trade to take because the price had cleared the previous resistance level. Notice that the price did return to the wedge after the breakout, but the wedge held and functioned as a support for the price to continue moving up.
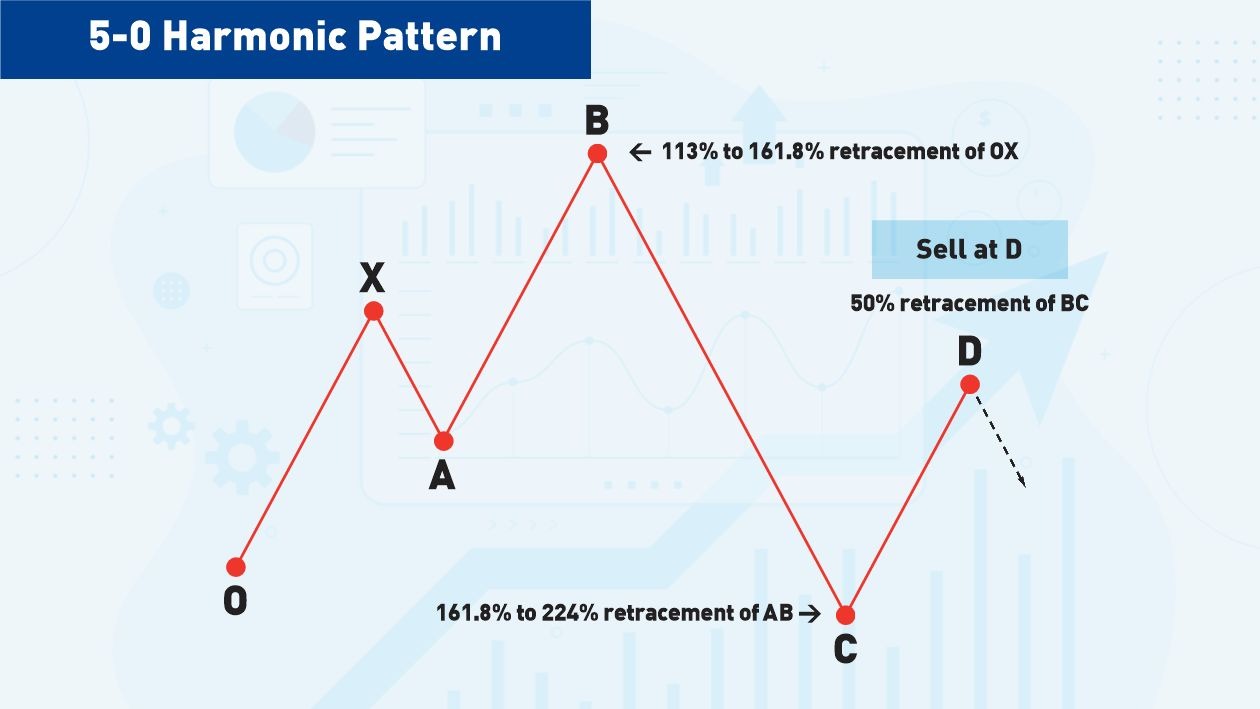
This example is interesting because the falling wedge made up the whole downtrend from when the price was near its all-time high. Eventually, the bottom of the falling wedge was near a previous support zone. The price then broke up and started a new bullish trend.
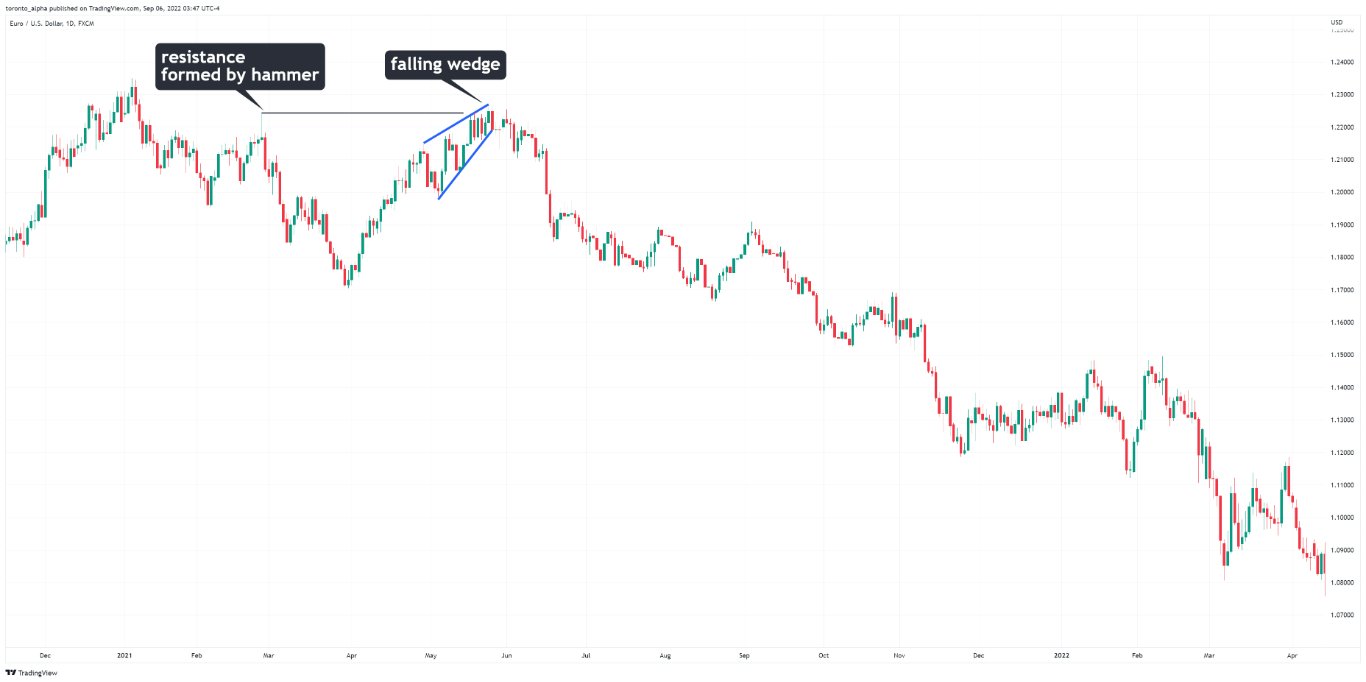
This triangle pattern Forex EUR/USD currency pair setup shown above is one of my favourites of all time. The market produced a hammer candlestick resistance on the daily chart. I had a bearish bias due to the bigger picture, and I was looking for confirmation. A falling wedge lined up with resistance made by the hammer candle, and it gave me an entry into a new downtrend which I followed for much of the year.
Bottom Line
- Triangles are one of the most frequently appearing chart patterns. Learning how they work gives you many more chances to find profitable trades.
- Triangle chart patterns are when the price forms a narrower range over time, creating a triangle.
- There are three types of triangles: ascending, descending, and symmetrical.
- All triangles can be continuation or reversal patterns, depending on the price action context before they appear.
- Small triangle chart patterns tend to continue the price, whereas large triangles can either continue or reverse the price.
- If a triangle has a flagpole immediately before it (a sudden spike or dive in price), the breakout will probably be in the same direction as the previous move. Flagpoles usually appear with symmetrical triangles.
- Wedges are like triangles. Falling wedges are bullish, and rising wedges are bearish. Wedges in the direction of trends (e.g., a falling wedge during an uptrend) are a fantastic way to enter a trend.
FAQs
What is a triangle pattern?
In a triangle pattern, the price moves sideways but in a tighter range as time passes. Eventually, the price must break out because the range cannot become any narrower.
How do you read triangles?
Use the market conditions to help determine whether the price will break out to the upside or downside. For example, small triangles during an uptrend will probably be followed by a bullish breakout from the triangle.
How do you trade triangle patterns?
Look at whether the market is trending or against support or resistance to give you a bias. If the price breaks out in the direction you expect, you can place a trade. Occasionally, if you are more confident of the market bias, you can place a trade before the breakout from the pattern.
What does a triangle pattern mean in trading?
A triangle is a consolidation, and the price may continue in the same direction as before the triangle formed, or the price may reverse.
Is a triangle bullish or bearish?
A triangle can be bullish or bearish, depending on the market conditions and the size of the triangle. For example, a small triangle during a downtrend is most likely bearish.
How do you trade descending triangle patterns?
You can wait for the price to break out of the descending triangle, and if the breakout is in line with the market context, you can place a trade. For example, if you see a descending triangle against a support level, and the price breaks the support when it leaves the triangle, you can assume the price will continue to move down.
Is a descending triangle pattern bullish?
Depending on market conditions, a descending triangle can be bullish or bearish. You must look at what the overall market is doing before deciding how to trade a triangle.
How accurate is a descending triangle pattern?
Descending triangles are discretionary patterns. They can be accurate if you are careful to read the market conditions.
What usually happens after a descending triangle pattern?
After any triangle, including a descending triangle, the price usually continues in the direction of the breakout.

