Swing trading refers to a trading strategy that revolves around capturing short and mid-term profits. This style of trading essentially utilizes technical analysis to identify chart patterns and exploit emerging trading opportunities.
Usually, swing traders hold a position for a minimum of one trading session and a maximum of a few days. However, some swing traders will hold their positions longer until the target is reached.
Trading Styles vs Trading Strategies
Swing trading is a style of trading, referring to an overall plan for how often you will trade, and the length of time positions will be held open. In contrast, a swing trading strategy is the methodology you employ to determine the price points for trade entry and exit.
Some swing traders prefer currencies with higher volatility (like exotic currency pairs), while others prefer more calm trading conditions. In essence, swing trading means buying lows and sell highs. It is all about capitalizing on price movements and you do not need to spend the entire day in front of the monitor as your trades last for days or maybe weeks.
Swing trading is a very popular trading style with retail Forex traders as they usually contain entry and exit techniques that require checking the chart perhaps only once or twice each day, or at most every few hours. This relatively relaxed schedule is very suitable for people with busy lives and full-time jobs.
This style of trading is quite popular among active traders seeking medium or long-term trades with the help of different types of analysis. Technical analysis is the most important analysis type to apply in swing trading, because of the relatively short-term duration of the trades. Additionally, fundamental analysis can be conducted to make an even better assessment.
In terms of the strategy they employ, swing traders will usually seek trading opportunities on the 1-hour, 4-hour, and daily charts. Successful swing traders tend to make only few trades over the course of a month.
Pros and Cons of Swing Trading Strategies
Advantages of Swing Trading
- Swing trading allows you to take advantage of the natural ebb and flow of the Forex market, potentially profiting when the market rises over a period of a few days, and then earning again when the market pulls back.
- By being in and out of the markets, you can identify more opportunities. A glance at any financial chart will show that there is almost always a definite long-term trend, but the market might not always be in a support or resistance area. This allows you to spread the risk around and ties up a lot less capital instead of constantly having to come up with margin for new positions as you find new trades. By closing your first position, you will not have to deposit more money in your account to cover the second one.
- Stop losses are typically smaller for short-term trades. The stop loss on a swing trade might be 100 pips based upon a 4-hour chart, while on a weekly chart that is based upon the overall trend it might be closer to 400 pips. This lets you place larger positions as opposed to low-leveraged positions based on longer-term trends.
Disadvantages of Swing Trading
- You must be well-versed in technical analysis. While not necessarily a “disadvantage”, it means extra work. Almost anyone can tell the trend on a chart that is going from the lower left to the upper right over time, but someone trying to swing trade that chart needs to identify entry and exit points. This is something technical analysis can do, but you need to learn it first. This takes time.
- It takes a different mindset than long term trading, and more nerve. You run the risk of being “spooked out of the markets” as pullbacks in these smaller ranges will seem more violent than they would appear to someone looking at a weekly chart. This is a psychological challenge, and one that most traders will eventually come up against.
Swing Trading vs Day Trading
In order to better understand the concept of swing trading, it is vital to note the difference between day trading and swing trading. The essential difference between these two concepts lies in position time frames.
Day traders move in and out of the Forex market multiple times in one day, while swing traders can hold their positions for as long as a few weeks. The two styles suit different traders, because of the difference in available capital, free time, market hours etc.
Day trading strategies are more suited for traders who hope for a quick compounding of gains. Day traders tend to close all trades at the end of the trading day. Hence, each day they aim to start with a clean slate to limit their exposure to weekend and overnight moves.
Deciding between the two styles depends on what type of a trader you are looking to become. Both swing traders and day traders seek to make a profit, but the difference lies in style, working methods as well as expected proficiency.
If you are ready to learn about technical analysis in greater detail and rely on it to make profits, swing trading might be better for you. However, be aware that you really need to be comfortable with using these tools, especially technical analysis.
Day traders, on the other hand, rely much more on charting systems, software, and some scalping techniques. Swing traders make a profit and incur losses much more slowly than day traders but incurring severe losses or making big returns in swing trading strategies is not uncommon either.
This is because swing traders tend to open fewer trades, but these are usually opened on larger positions. On the other hand, swing trading is different from position trading as the latter is a long-term trading approach where positions are held over a few months.
The Best Strategies for Swing Trading
There are multiple types of swing trading strategies. Let us now take an in-depth look at three of the most popular and effective examples of swing trading strategies for Forex traders.
Range Trading
Using technical analysis tools to find support and resistance levels, range trading is one of the more popular trading approaches.
This type of trading strategy aims to capitalize on ranging currency pairs that are mostly moving sideways between identified support and resistance levels.
Traders are looking where the buyers may face challenges during an uptrend i.e., which levels higher than the current market price are likely to function as resistance. Conversely, they also look to find support levels that act as a “floor” which prevents the price action from travelling below those levels. One of the most popular forms of range trading is rectangle trading.
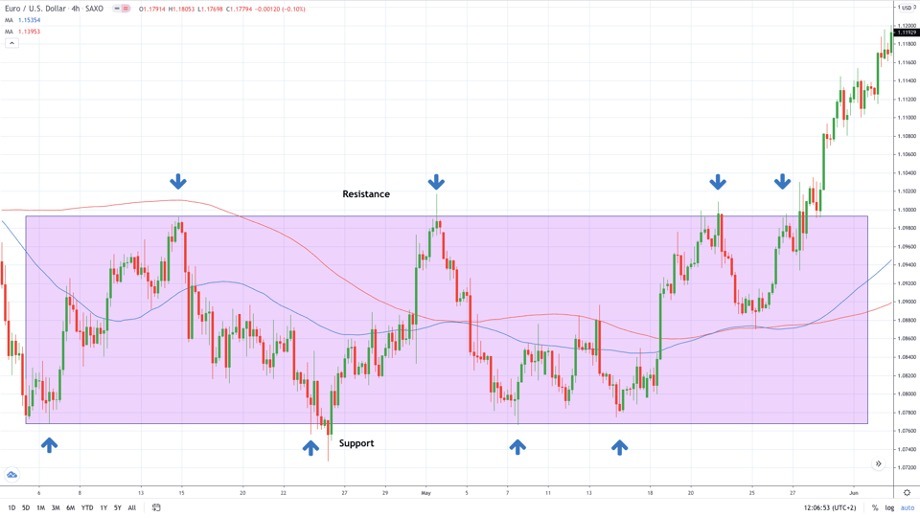
As you can see in the chart above, the price action is confined for most of the period within a trading range. Over a period of two months, the price action touched or came very close to support and resistance levels on eight occasions. Only once out of a total of eight swings did the price action leave and close outside of the rectangle.
Therefore, this swing trading Forex strategy is simple: buy the lows and sell the highs. Now we will look at how to base your trading setup in range trading.
Once the price action approaches the support or resistance levels, you start monitoring the price movements more closely. You can place buy/sell orders near these levels to automatically open trades.
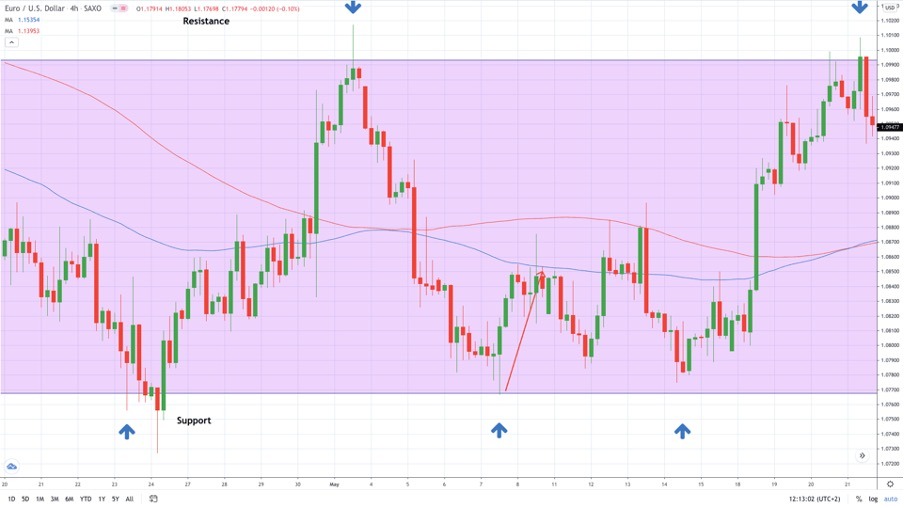
In the centre of the above price chart, we see the price action moving lower, after creating a false breakout at the top of the chart. Our buy order sits at $1.0770, a few pips above the rectangle’s support. The stop loss is placed about 25 or 30 pips below the support line to allow for uncontrolled market moves. Let’s say we place our stop loss order at $1.0745.
The take profit order placement depends on your trading style. If you are a more aggressive trader, you will be looking for a move towards the opposite end of a range. Alternatively, you could decide to book profits when the price action approaches two moving averages - the 100-period and 200-period.
If you opted for the exit at the moving averages exit scenario, you would have closed your profit at $1.0850 to book 80 pips of profit. Hence, you risked 25 pips to gain 80 pips, a risk-reward ratio of more than 1:3. You needed just one day to complete your trade.
If you had waited to exit until the price reached the other end of the rectangle, it would have taken approximately 2 weeks for the price movement to reach that area, booking you about 220 pips of profit.
Breakout Trading
Breakout trading is the opposite of trading ranges. A breakout occurs when the currency breaks above resistance or below support on rising volume (in Forex, the volume component is often ignored as there is no central volume data source for the Forex market). As a result of the breakout, the market is more likely to trade in a continuing uptrend or downtrend.
The best breakouts usually take place after long consolidation phases. A great advantage of breakout trading is the fact it works on all and markets.
The first phase in breakout trading is finding a currency pair that is trading in a consolidation phase, which is characterized by decreasing volatility.
Breakout traders can trade breakouts from other consolidation formations as well as rectangles, such as channels, wedges, pennants, triangles, and flags. The key focus is the point when the price action breaks outside of the defined range, preferably on rising volume.
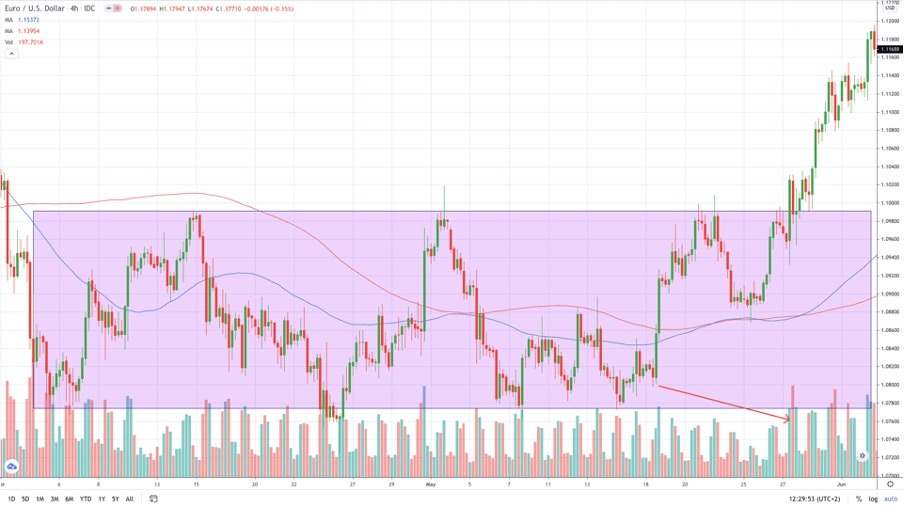
Looking at the same price action as in the earlier example chart, EUR/USD is trading within a confined range. The red arrow shows that volume is decreasing, which points to a potential breakout scenario. Although the price action briefly moves above the resistance of a rectangle, the volume shown in the indicator at the bottom of the chart does not indicate a successful breakout move is likely to happen.
However, the price then leaps higher to close comfortably above the rectangle. This time, the volume figures print the highest level seen in the last few months, verifying this breakout. The red arrow in the price chart below shows the volume data behind the breakout candlestick.
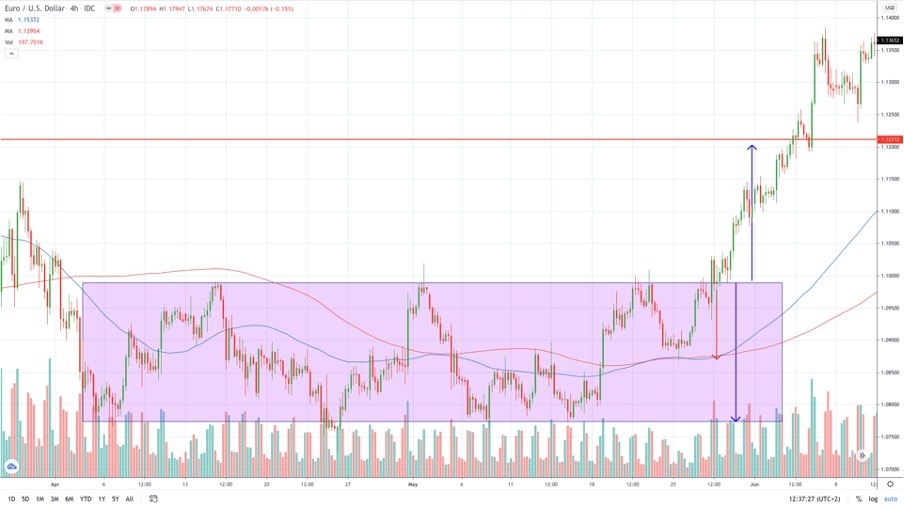
Once the price action closes above the rectangle’s resistance on a higher volume, we move towards finalizing our trading setup. Potentially, there are two entry strategies we can try here. The first option is to open a buy position as soon as the price closes above the resistance line. The second option is to wait for a “pullback” - a retest of the broken resistance that now acts as support.
Taking the immediate buy option means you are in the game as you enter the market without any hesitation. The pullback option offers a better risk-reward ratio as your entry point will be closer to your stop loss. However, there are no guarantees that the price action will return lower for a retest, meaning that if you wait for a pullback, you might miss the opportunity.
In this illustrated case, both scenarios would have worked out well. The difference in entry price was around 30 pips. A stop loss should be placed around 40 pips below the former resistance to have some cushion in case the market whips lower.
Since we are trading a breakout from a rectangle, we measure its height to calculate our profit-taking level. The end of the upper blue arrow signals the zone where we should consider taking our profits.
A week later, EUR/USD hits our take profit order to book us between 190 and 220 pips, depending on the entry option chosen. Therefore, the risk-reward ratio in this trade is around 1:5.
Swing Trading with Fibonacci Retracement
Fibonacci retracement is a technical analysis indicator used by traders to find potential support and resistance levels on a chart. Based on a numerical series, Fibonacci uses horizontal price levels to determine potential areas of interest for buyers and sellers.
There are five widely used Fibonacci retracement levels: 23.6%, 38.2%, 50%, 61.8%, and 78.6%. Out of these five, the three middle values (especially the 50% value) are considered the strongest. Fibonacci retracements are drawn by connecting a price point on the chart when the uptrend or downtrend started, to the point when it ended. In essence, you connect the swing high with swing low, and vice versa.
Fibonacci retracements are one of the most popular technical indicatorsand they tend to cause a market reaction when they are confluent with other indications of support or resistance.
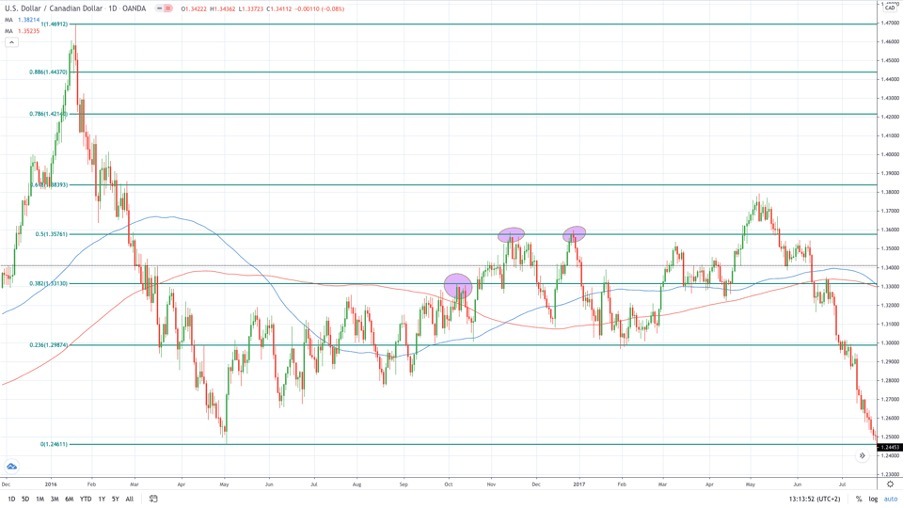
In the USD/CAD daily chart shown above, we connect the start and end point of a downtrend to generate Fibonacci retracement levels. This swing trading Forex strategy is focused on three central retracement lines - 38.2%, 50% and 61.8%. Our goal is to try and capitalize on possible market reactions off these levels.
The first purple circle highlights a bearish market reaction. The price action rotated lower as soon as it touched the 38.2% Fibonacci retracement for the first time. The same scenario followed at 50% retracement, while price movements never quite reached the 61.8% Fibonacci retracement level.
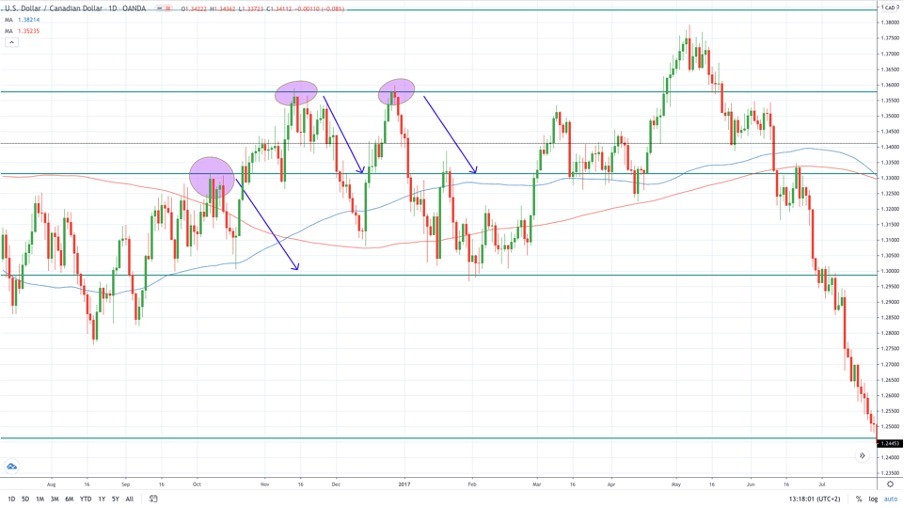
The next step with this trading strategy is to sell USD/CAD any time that the price hits a retracement level. Our aim is to hold the position open until the price movements retrace to the first lower Fibonacci retracement. Hence, selling at 38.2% retracement to reach the 23.6% retracement line.
This means we are selling at $1.3315, hoping to see a pullback to $1.30, an area which hosts the 23.6% retracement level. The stop loss should be placed around 40-50 pips above the 38.2% Fibonacci retracement level, protecting us against any explosive breakout higher. Any move above $1.3360 is likely to invalidate our trading setup.
On the other hand, we aim to close our trade around the $1.30 handle. This would result in a 300+ pips move and a risk-reward ratio of 1:6. Eventually, the chart shows that the price action retraced to $1.3306 to reach our profit zone.
The same methodology should be applied to the two later occasions when the 50% retracement line capped upward moves. In both cases, the price action retraced comfortably to the lower Fibonacci retracement line.
Swing Trading Takeaways
- Swing trading refers to a trading strategy that revolves around capturing short and mid-term profits over a period of at least a few days to several weeks or months.
- Swing traders usually base their trending setups on 4-hour and daily charts.
- Swing trading strategies are all about anticipating the next price movement, entering a position, and capitalizing on the price movement.
- Swing trading is different from day trading as the latter involves opening and closing all trades in a single day.
- Swing trading requires a solid understanding of technical analysis, although you do not need to be a technical analysis expert to be profitable as a swing trader.
Bottom Line
Swing trading in the Forex market offers a potential for substantial profits, but also requires a thorough understanding of market dynamics and technical analysis, while demanding a disciplined approach.
By implementing the various strategies discussed in this article, traders can develop a more informed and strategic approach to swing trading, enhancing their ability to make profitable decisions in the dynamic world of Forex trading. Whether you're a beginner or a veteran trader, swing trading in Forex can be rewarding, provided you're equipped with the necessary knowledge and tools.
You might also be interested in reading the below articles:

