Click to Enlarge
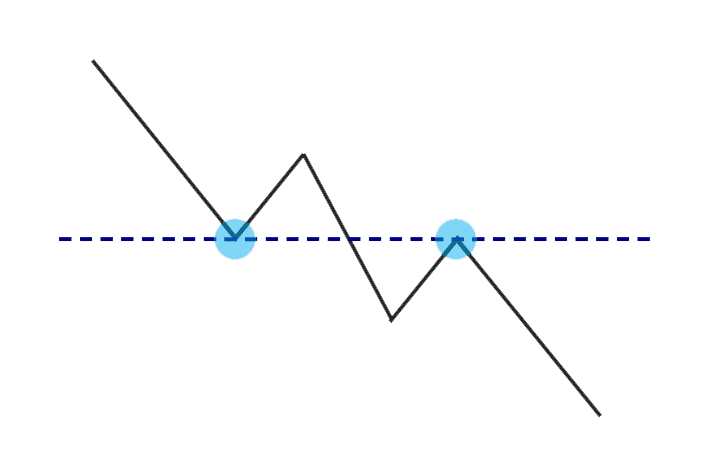
You may have seen the above scenario play out on your charts: you spot a Support and the Support gets broken; the market rises back up and bounces against that previous Support level. In other words, Support has become Resistance. They’ve reversed roles.
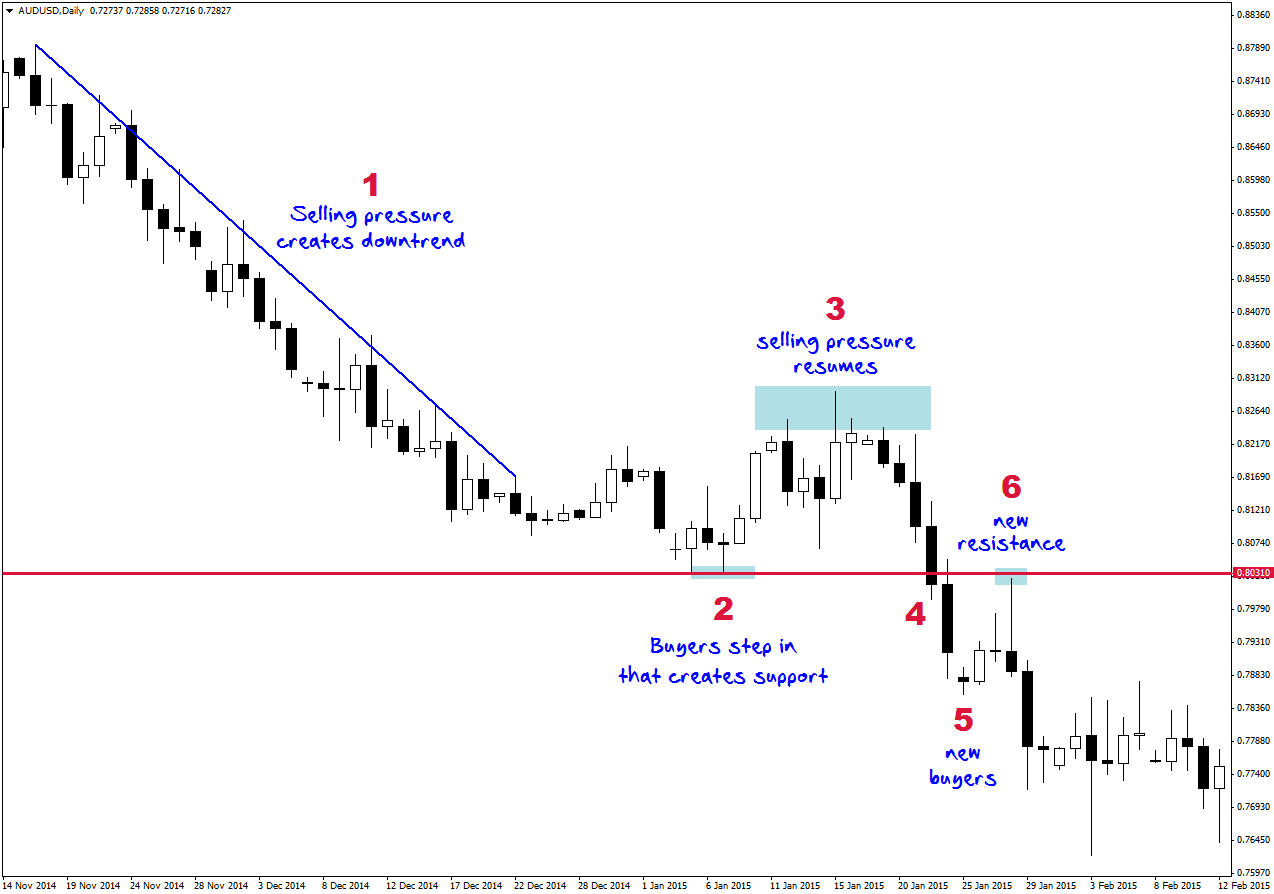
Now, that’s straight forward in principle but what’s the psychology behind the market and how do we trade this information? Let’s look at a real-life trading scenario in this AUD/USD daily chart.
And now let’s walk through a trade by reading the chart from left to right.
Phase 1. Selling pressure creates a downtrend.
Phase 2. Increased buying pressure steps in to pause the downtrend and create a Support. The buying pressure could be from traders covering their short positions or because new buyers believe the market has gone down far enough.
Phase 3. After the market rises briefly, the dominant trend established in Phase 1 continues pushing the market back down.
Phase 4. The market breaks the previous Support. Keep in mind that the buyers that bought when the Support was created (Phase 2) now have their trades sitting at a loss. These traders would want to get out at breakeven if given the opportunity.
Phase 5. After the broken Support area, there’s a pullback as further buying steps in. This is typical of how a market moves: in waves of buying and selling.
Phase 6. Here we can confirm if the downtrend will continue after the Support was broken (i.e. the break was not a false breakout). And next, we find a point to enter our trade. Without a point of entry for our trade, none of this matters! As the market moves up and reaches the broken Support, we should expect the previous buyers to get out at breakeven. This will create a new wave of selling and that’s why Support turns into Resistance.
However, this is not a guaranteed outcome. Of course, the market could just continue rising past the broken support and start a new uptrend. Therefore, we have to see a clear rejection of this price level to show that the downtrend is still in play.
In this chart, that is exactly what happens: a bearish Pin Bar is produced within a few pips of the previous Support. A Pin Bar at this price level means there is confluence to give a strong entry signal.
Entering the trade: You can enter at the open of the next bar after the Pin Bar. Your Stop-Loss should be a few pips above the high of the Pin Bar. Your Profit Target could be a simple 1:1 risk/reward or you could trail your Stop-Loss for a larger target. The 1:1 Profit Target is hit immediately at the next candle.
A better entry method would be to go down to a lower timeframe, such as the hourly, and see if a Resistance is produced at the previous Support level on that lower timeframe. This would provide you a superior risk/reward for your trade. I took this trade on the daily Pin Bar with a 1:1 reward so I’m not going to pretend to have done better than that!
Sometimes a Support or Resistance will break and the market will just continue without pulling back much. In those cases I miss the trade even though I’m correct on the direction. That’s okay – you can’t catch every single move all of the time. You have to decide your criteria for each trade to make sure the probabilities are in your favour. And you must enter only when all those criteria have been met. Trading requires patience above all else.


