Pivot points are one of the most widely used technical tools amongst Forex traders, and their unique structure provides a distinctive window into potential price movements.
Top Forex Brokers
Pivot points are popular because the calculations that build them are one of the easiest to understand in the universe of indicators. Their simplicity means traders can intuitively understand pivot points and how they should use them on charts.
Read on to find what pivot points are, how they are calculated, and how traders can use them to determine support, resistance, or breakout levels effectively for more profitable trading.
Note: there are different types of pivot points including standard pivot points, Woodie’s pivot points, camarilla pivot points, Fibonacci pivot points, and Demark pivot points. This article will focus on the most popular version, standard pivot points.
What Information Do Pivot Points Give?
Pivot points give two main pieces of information:
- A bullish or bearish sentiment of the price.
- Future support or resistance levels.
To explore how to find support and resistance with pivot points, let’s first look at how to calculate them.
How Are Pivot Points Calculated?
Traders do not normally calculate pivot points by hand—instead, they will usually display it on the chart as an indicator, with the indicator making and displaying the calculation results automatically on the price chart. However, it can be useful to understand the calculation, so you get a better idea of what pivot points represent when you see them displayed on a price chart.
The first step is to calculate the main, central pivot point. After that, we can calculate the other pivot points as they are derived from the central pivot point.
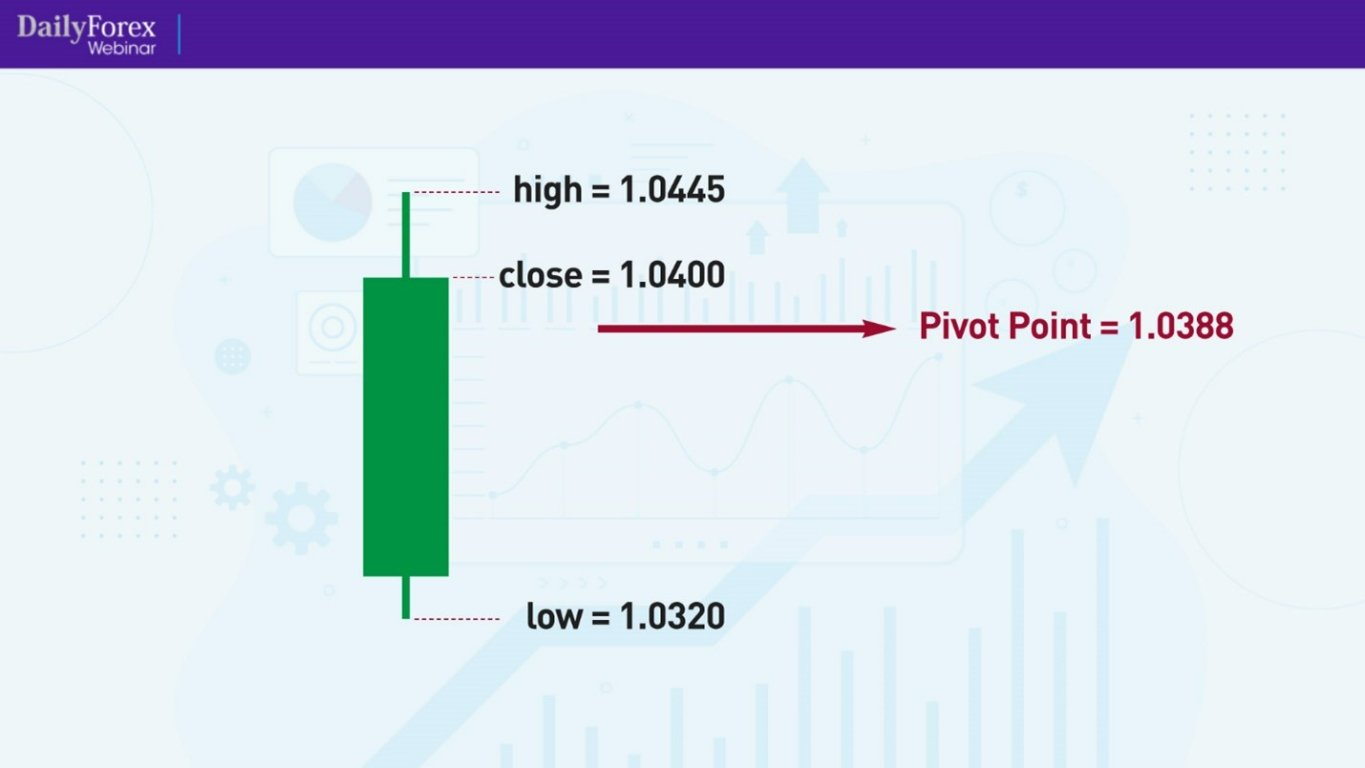
The central pivot point is the average of the previous candle’s high, low, and close. Mathematically, this is represented by the following formula:
Pivot Point = (High + Low + Close) / 3.

The most recent candle dictates Pivot Points.
Pivot points are always calculated using only the most recent candle. In contrast, most other indicators, e.g., moving averages, RSI, etc., consider several previous candles to derive their levels. For example, a 10-period moving average calculates the average closing price of the last ten candles.
Remember, I cannot use the current candle when calculating pivot points. I must use the previous candle or wait for the current candle to close.
Trading the Pivot Point
Traders that use pivot point strategies consider the market bullish or bearish depending on which side the price is of the pivot point:
Bullish when the price is above the Pivot Point
Bearish when the price is above the Pivot Point
This is the most basic way to use a pivot point. However, this is not a signal to blindly jump into a trade just because the price is above or below the pivot point. I would need other factors to confirm a trade.
Now, let’s look at the secondary pivot points derived from the main central pivot point.
Finding Support and Resistance with Pivot Points
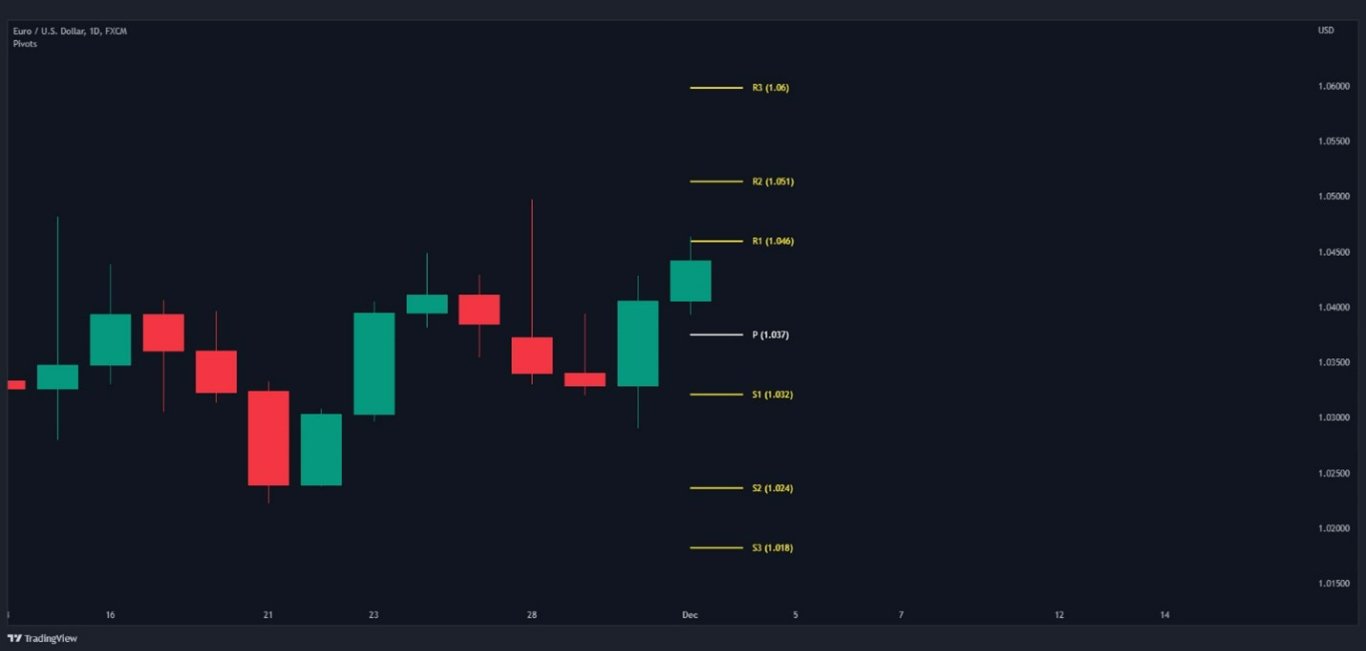
From the main central pivot point, we can calculate secondary pivot points, which can be used as support and resistance levels, on each side of it. A common setting is 3 resistance levels above the pivot Point (known as R1, R2, and R3) and 3 support levels below it (known as S1, S2, and S3).
I’ll write out the calculation for each one in the order in which they appear on the chart from the highest level (R3) to the lowest level (S3), with PP representing the value of the main central pivot point.
R3 = High + 2*(PP – Low)
R2 = PP + High – Low
R1 = 2*PP – Low
Pivot Point = (High + Low + Close) / 3
S1 = 2*PP – High
S2 = PP – (High – Low)
S3 = Low – 2*(High-PP)

My platform, TradingView, can display up to five support and resistance levels (i.e., R1 to R5 and S1 to S5), but when I use pivot points, I will change the settings to display only the first three levels.
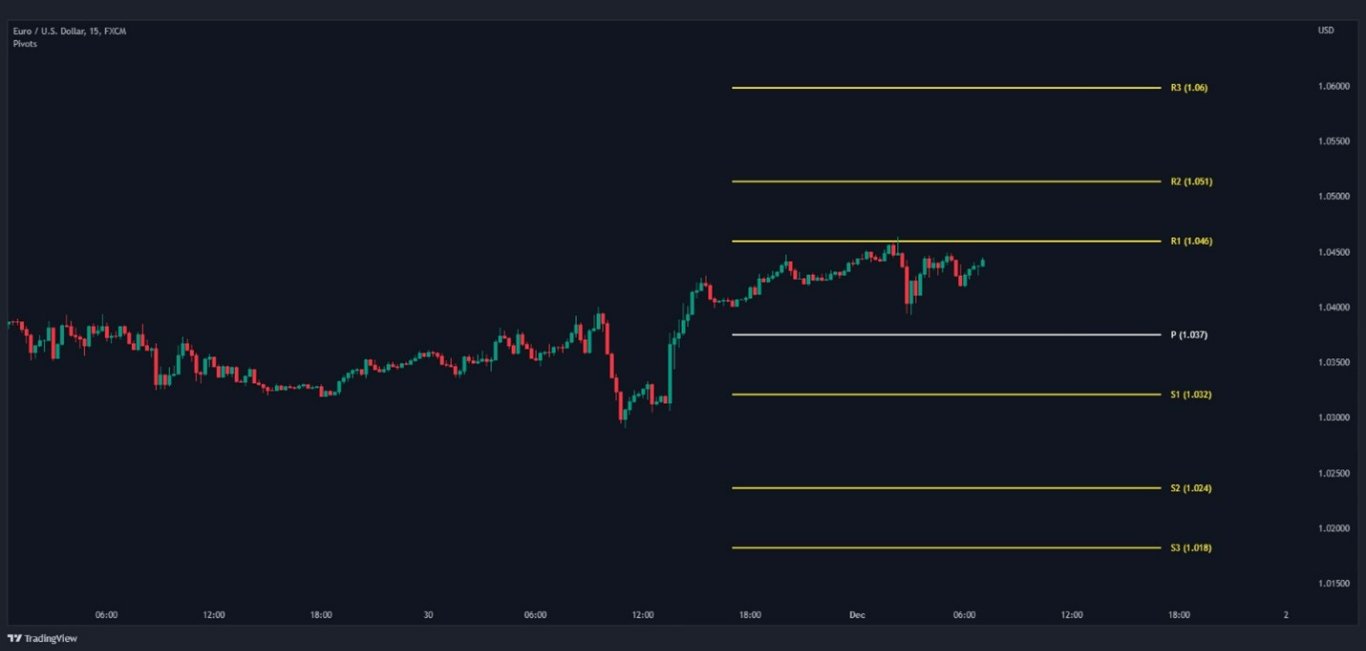
Pivot point trading strategy idea: move down a timeframe from the levels.
Each candle will produce its own pivot point levels. This means the levels will change with each candle. So, one way to trade pivot points is to move down a timeframe. For example, plot pivot points on a higher timeframe and then use them on a lower timeframe to trade.

Trading Pivot Point Levels as Support and Resistance
Let’s say I am generally bullish on the EUR/USD currency pair, and I want to use pivot points to help plan my trades. These are the steps I can take:
- I wait until the price is above the main central pivot point.
- I won’t enter a trade if the price is slightly below R1 or R2. I will either wait for the price to break above one of these resistance levels and preferably use that level as a support.
- If the price is above R3, I may pass on the trade—there is a good chance the price is over-extended, and most of the upwards movement is finished, with a bearish retracement quite likely to happen next.
Support and Resistance Role Reversal
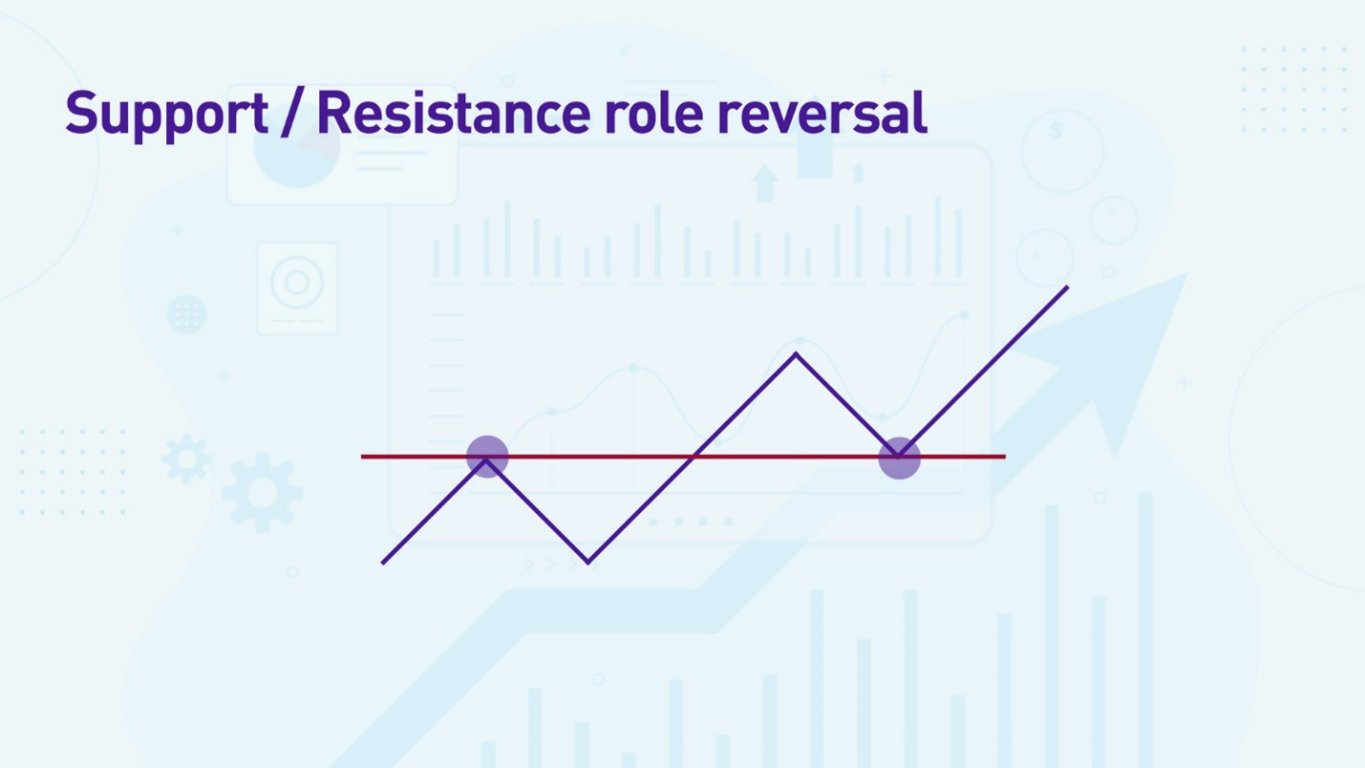
Because pivot point trading is usually a type of support and resistance strategy, it’s worth understanding the concept of support and resistance role reversal. This is when the price breaks a resistance level, and it subsequently turns into support or the other way around, the price breaks support, which then turns into resistance on the way down.

Let’s say I’m bullish, and the price breaks R1. I can wait for R1 to turn into support to confirm the level before entering a long trade.
Statistical Probabilities
Having a fixed calculation for future support and resistance levels means traders can measure historically how often the price reached those levels in the past, and then potentially use those statistics to judge future probabilities. For example, with the EUR/USD currency pair over the past 12 months, let’s say R1 & S1 have been reached by the price on 42% of days. I don’t know if that’s true—I’m using this number as an example. If I have a long bias, I may choose to put the take-profit slightly below R1 because I know that more than half the time, the price does not reach there on the same day.
Market Context Matters
There’s a reason why I am not giving a fixed set of rules to trade pivot points in this article. Any indicator should only be used as part of the overall market context. I want to know the bigger picture trend, chart patterns or support and resistance levels. Pivot points can then help me capitalize on that. For example, if I see a big support level on the higher timeframe that I think will hold, I may go long at S1 or even S2 if they are confluent with that level, even though that is below the main central pivot point because I see S1 and S2 as strong retraces within the bigger picture. One way to use pivot points is to place the indicator on the chart and see if any pivot points are confluent with price levels which you already see as significant for another reason – and if so, to treat these levels as more likely to hold as support or resistance due to the confluence.
Find Pivot Points on MetaTrader MT4 & MT5
At the time of writing, I noticed that the versions of MetaTrader I’ve downloaded from a few brokers do not have pivot points automatically as part of their indicator suites. That may be because of the specific versions I’ve downloaded, but you may have found the same issue. The great thing about MetaTrader is that there’s a huge community that write indicators to add-on. I searched online for “pivot points for MetaTrader” and found options for installing pivot points indicators.
Bottom Line
Pivot points are a unique indicator using only the previous candle’s high, low, and close for the calculation.
A pivot point can show a bullish bias if the price is above the pivot point and a bearish bias if the price is below the pivot point.
Additionally, pivot points can act as future support and resistance levels which indicate where the price may pause or reverse. Traders can also use the levels to place stop losses or profit targets.
Finding support and resistance with pivot points should be done in line with the broader market context, for example, trading in line with the higher timeframe trend, or paying attention to only the pivot points which are displaying confluence.
FAQs
Do pivot points work in Forex?
Pivot points can work in Forex if used in conjunction with other strategies but are widely agreed to provide no meaningful statistical edge on their own.
How do you use pivot points effectively when trading Forex?
The most effective use of pivot points in trading Forex is to use the pivot points as potential support and resistance levels to plan trades in line with the broader market context.
What is a pivot point strategy?
An example of a pivot point strategy would be to look at the trend on the daily chart, plot pivot points from a daily candle, and trade the support and resistance levels from the pivot point on an intraday chart.
Which pivot point method is best? The best pivot point method is to find the higher timeframe trend and trade the support and resistance levels from the pivot point on the lower timeframe in line with that trend.
Who invented pivot points?
It is not known who invented the standard pivot points.
What are the different types of pivot points?
Different types of pivot points include standard pivot points, Woodie’s pivot Points, Camarilla pivot Points, Fibonacci pivot Points, and Demark pivot Points.
Which pivot type is best?
The most popular pivot type and the one that attracts the most interest from traders is the standard pivot point.
