I love writing about chart patterns because they form the foundation of technical analysis, providing a direct and unfiltered view of the markets. Few people are familiar with the Quasimodo chart pattern, which is a pity, because they’re missing out on a great chart pattern and a fantastic way to trade the markets.
Top Forex Brokers
Let’s dive into the Quasimodo pattern, learn how it works, and how we can trade it.
What Is the Quasimodo / Over & Under Chart Pattern in Forex?
The first thing to know about the Quasimodo pattern also referred to as the Over and Under pattern, is that it is a price-based chart pattern.
Usually, the Quasimodo is a reversal pattern. This means that the price typically reverses direction after forming the pattern. However, it can also be used to continue the price direction.
Like most chart patterns, it has a bullish and bearish version, which are mirror images of each other (i.e., the bullish Quasimodo is an upside-down version of the bearish Quasimodo).

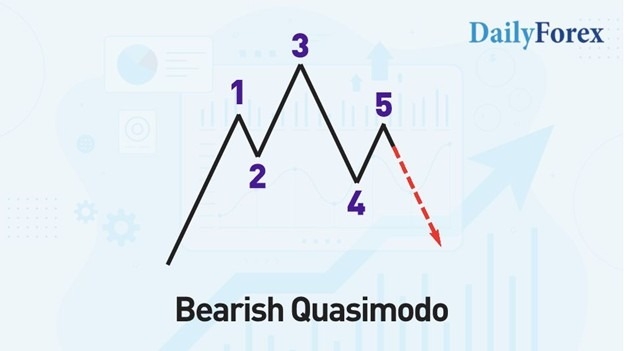
Bearish Quasimodo Features
- The price moves up to make a high, i.e., a left shoulder.
- The prince moves down to make a low. At this point, this moves like a regular pullback.
- The price then moves up to create a higher high, i.e. a head.
- The price moves below point 2.
- The price moves back up and creates a new high, i.e., the right shoulder, before moving down.

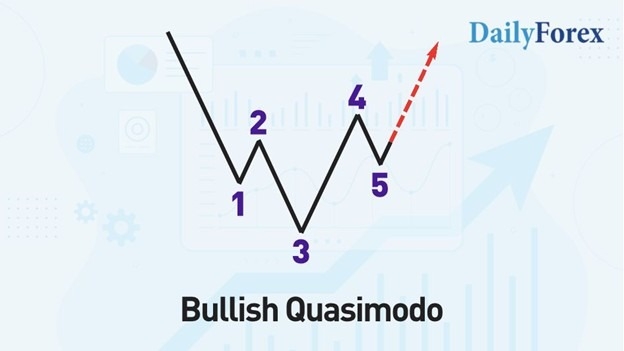
Bullish Quasimodo Features
- The price moves down to make a low, i.e., a left shoulder.
- The price moves up to make a high. At this point, this moves like a regular pullback.
- The price then moves down to create a lower low, i.e., a head.
- The price moves above point 2.
- The price moves back down and creates a new low, i.e., a right shoulder, before moving up.
What Is the Difference Between Quasimodo and Head-and-Shoulders?
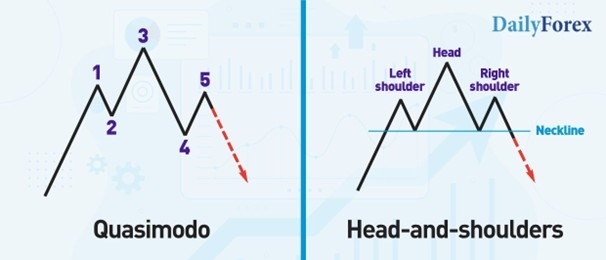
If you know the head and shoulders pattern, you will have spotted its similarities with Quasimodo. However, the Quasimodo is not identical to the head-and-shoulders pattern. Let’s look at them side-by-side for their differences:

- The head and shoulder pattern typically has a horizontal “neckline” that connects the peaks or troughs between the shoulders. For a Quasimodo, there is no neckline. Instead, Point 4 (which connects the head to the right shoulder) must go beyond Point 2 (which connects the left shoulder to the head).
- The head-and-shoulders pattern is generally symmetrical. In contrast, the Quasimodo pattern has a much more uneven appearance.
- The Quasimodo pattern is more challenging to identify on charts compared to the head-and-shoulders pattern. Our brains are naturally drawn to more symmetrical shapes, making the head-and-shoulders pattern more easily identifiable.
- Once the second peak or trough (Point 5) on the Quasimodo has formed, the pattern is complete. In comparison, for a head-and-shoulders pattern, the price must break the neckline to be complete.
- Since the Quasimodo pattern does not have a neckline to break to complete its formation, trade entry occurs much closer to the most recent peak or trough. As a result, Quasimodo trades often have better reward-to-risk ratios than head-and-shoulders trades.
How to Trade the Quasimodo Pattern
Here is a step-by-step guide to trading the Quasimodo pattern that can be part of a Quasimodo trading strategy for Forex or any other asset class:
- Decide the timeframe for trading the Quasimodo pattern. For example, short-term or intraday traders may look for the pattern on 15-minute charts, whereas swing traders may prefer 4-hour or daily charts.
- Determine the market conditions under which to trade the pattern. For example, chart patterns such as the Quasimodo are much more meaningful after a trend. I look for a trend or a directional move that precedes the Quasimodo pattern, rather than waiting for it to appear in the middle of a range.
- Ensure the pattern meets the rules for its formation, in particular:
- For a bearish Quasimodo, the central peak is higher than the peaks on either side. For a bullish Quasimodo, the central trough is lower than the troughs on either side.
- Point 4 (which connects the head to the right shoulder) must go beyond Point 2 (which connects the left shoulder to the head).
- Establish rules to verify the entry point. For example, this could be an indicator, such as a MACD divergence or a price crossing a moving average.
- Set a stop-loss. A standard stop-loss placement is just beyond the left shoulder or the head of the pattern. If the entry is close to the left shoulder, placing the stop-loss beyond the head will give the trade more room to breathe.
- Set a take-profit target. Common profit targets are Point 2, located between the left shoulder and head, or Point 4, situated between the head and the right shoulder. However, if I sense the pattern is reversing or continuing a significant trend, I may set a much more distant take-profit target. If the stop-loss is greater than the take-profit, i.e., if I am risking more than the potential profit, I will not take the trade. As a rule, I only take trades with a reward-to-risk ratio greater than 1.
How Can You Verify QM Signals?
To verify the pattern, or more specifically, to confirm the entry point, I often use an indicator to help. Here are some practical options:
- MACD. I’ve always enjoyed using this indicator, either as a divergence tool or when the histogram changes from negative to positive (red to green on most trading platforms) or vice versa. (I prefer using MACD as a divergence tool.) Although the MACD is based on moving average calculations, I find that its sophistication yields fewer false readings than using moving averages alone.
- RSI divergence. The RSI is sensitive to momentum changes, and when used as a divergence tool, it’s a solid way to look for upcoming reversals in the price direction.
- Moving Averages. Look for the price to cross a single key moving average in the direction of the trade or use two moving averages as a crossover. This is a straightforward method to determine if the price is potentially changing direction. It takes less interpretation and subjectivity compared to MACD or RSI divergences.
Remember, the above methods are for verifying the Quasimodo entry. It is more important to ensure the Quasimodo pattern is valid and appears after a strong price move or trend.
Quasimodo Trading — Pros and Cons
Pros
- The Quasimodo formation is a price-action chart pattern. These types of chart patterns offer a direct and unfiltered view of the market, representing the purest form of technical analysis. For decades, technical traders have utilized chart patterns to execute trades without relying on indicators. I’d go so far as to say it is essential to understand chart patterns to have a long and profitable trading career.
- The Quasimodo can give entries much earlier in a move than a head-and-shoulders pattern. It therefore offers potentially higher reward-to-risk ratios.
- It can be both a reversal and continuation of a trend.
- Like all chart patterns, it’s valid across asset classes, from Forex, to equity indexes, commodities, and cryptocurrencies.
- Traders can use the Quasimodo pattern across timeframes, from intraday trading to longer-term swing trading.
Cons
- The Quasimodo pattern is difficult to spot on charts and takes practice to identify. Sometimes, I still miss it on charts, whereas I can instantly spot a head-and-shoulders pattern.
- This is one of the more subjective chart patterns, making it more challenging to trade consistently.
- Without a neckline, the Quasimodo often requires additional confirmation methods for entry compared to a head-and-shoulders pattern.
My Take
The Quasimodo is a strong chart pattern, and its strongest use is as a reversal pattern after a trend or directional price move. However, it can also be a continuation pattern, for example, when a bullish Quasimodo appears during an uptrend. It is asymmetrical and often messy compared to other chart patterns such as double tops and bottoms and the head-and-shoulders pattern. This makes the Quasimodo much more challenging to spot and trade consistently, relative to other chart patterns. My advice is only to trade it when the Quasimodo setup is obvious. It is okay to miss some opportunities if they are not evident in real time. Trading is about assessing the market and entering only when the conditions are reliable and well understood.
