By: Mike Kulej
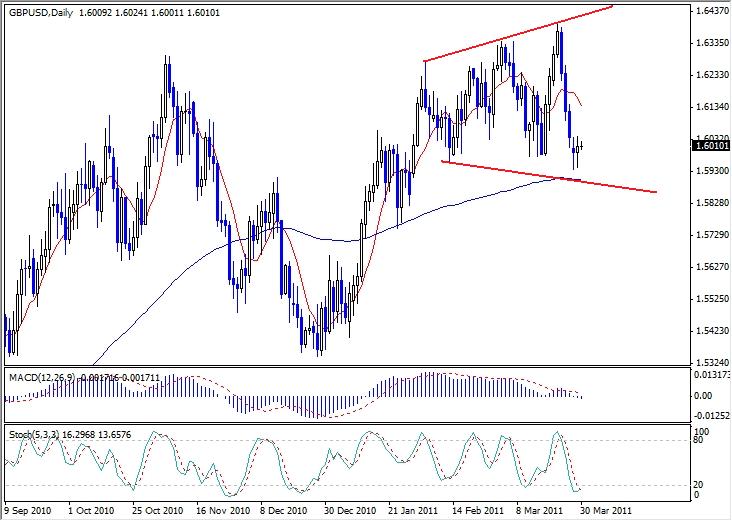
Early in 2011, the British Pound started a nice rally. It took the GBP-USD from a low of 1.5344 to a recent high of 1.6400. Perhaps even more telling is the fact that the price moved above the previous high of 1.6300. That would suggest a bullish tendency within a major trend.

Unfortunately, this is not evident from the behavior during the past few weeks. While the GBP-USD keeps making new highs, corrective price swings also exceed preceding lows, thus negating the latest breakout and forming a widening triangle on a daily chart.
The widening triangle is a holding pattern. By some accounts, it favors a continuation of earlier trends, but not by a decisive margin. However, its borders contain the price and the eventual breakout can present a trading opportunity. As of right now, its direction is not clear and will probably depend on a yet unknown, new fundamental development.
Meanwhile, for as long as the triangle holds, the Stochastic Oscillator is correctly marking the turning points. The overbought/oversold readings correspond with the price reaching triangle’s borders. This will not last indefinitely, and the GBP-USD will break out. For now, though, shorter trading opportunities can be found within the triangle.
