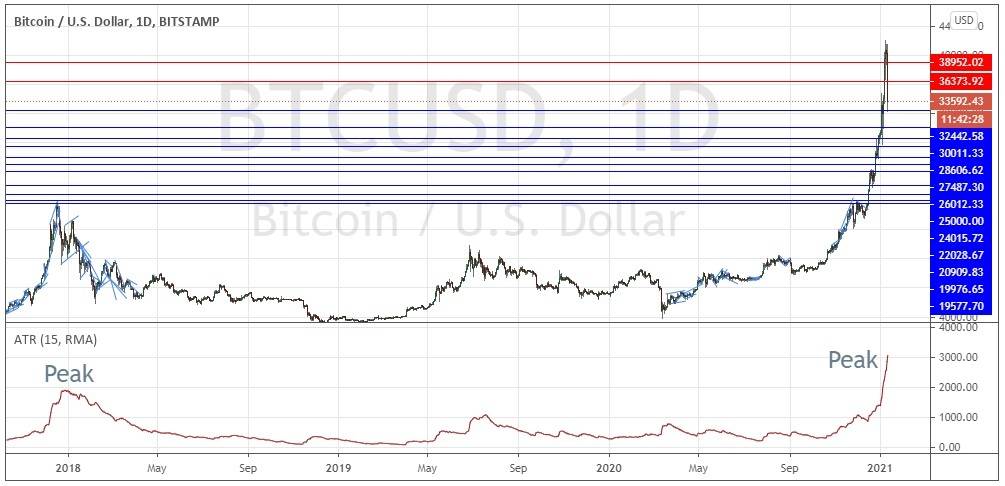
Bitcoin rose by a meteoric 132% in U.S. dollar terms over less than one month, from 12th December 2020 to 8th January 2021, when it reached an all-time high price of $42,000 per coin. That's more than double the value of its record high of $19,270, which had remained unbroken since the last days of 2017.
Although the obvious supportive zone centered near the big quarter-number at $32,500 has held so far as at the time of writing, the short-term price action is suggesting support may well break down, as Bitcoin falls from the resistance level at $36,374.
History of Bitcoin Peaks
Bitcoin has seen much sharper falls than a 23% drop on several recent occasions. What makes the current fall in price so interesting to cryptocurrency market analysts is that it occurred very rapidly from an all-time high after an enormous increase in volatility.
The above price chart shows the daily price candles of Bitcoin in USD terms since late 2017 in its upper section, and the 15-day average true range (ATR) in its lower section. The late 2017 peak is seen at the far left showing the average daily price range increasing from approximately $500 to $2000. This represents an increase in the daily range by a factor of four. This was not seen again until the summer of 2019 (not marked in the price chart above), a period which produced a strong, long-term fall in the price of Bitcoin. Finally, when we look at the right edge of the price chart, we can see the average daily volatility has increased by more than a factor of four.
Another interesting factor which presents a parallel between the current picture and these two periods is that we again see Bitcoin reaching an average price movement of approximately 10% in value every day, which is an extremely high level of volatility for any asset and one that is unlikely to be sustained for a long-term period.
An additional consideration: all cryptocurrency is falling, not only Bitcoin. Ethereum, the second largest cryptocurrency after Bitcoin by market capitalization, has fallen by an even greater amount from its recent peak. Although Ethereum has also enjoyed a very strong rise in its price in fiat currency terms, unlike Bitcoin it has not bettered its all-time high which it made in early 2018.
Finally, the 2017 peak was put in right at the end of the calendar year, in December. Although this Bitcoin high – if it does hold – was made in early January, there is some evidence of a year-end effect in asset price bubbles, possibly due to taxation laws.
What Does This Mean for Me?
Having detailed here a growing technical case that Bitcoin has made a long-term high price, despite recent forecasts by respected analysts of continuing growth up to $50,000 per coin, the following logical conclusions can be reached:
Investors in Bitcoin should seriously consider whether the time has come to exit any long or medium-term investment in Bitcoin.
Anyone considering any lengthy investment in Bitcoin should consider carefully whether this is an appropriate time to buy Bitcoin, or whether to wait for the high volatility to settle down.
Bitcoin traders – at least, those not prevented from trading Bitcoin by new FCA regulation – should expect very high volatility and unpredictable price swings to continue for some time, as is typical when such a high level of average daily volatility has been reached by a speculative asset. This means directional flexibility and keeping trade position sizing very small. Shorting is a possible option, but if taken it should be conducted and monitored very carefully.


