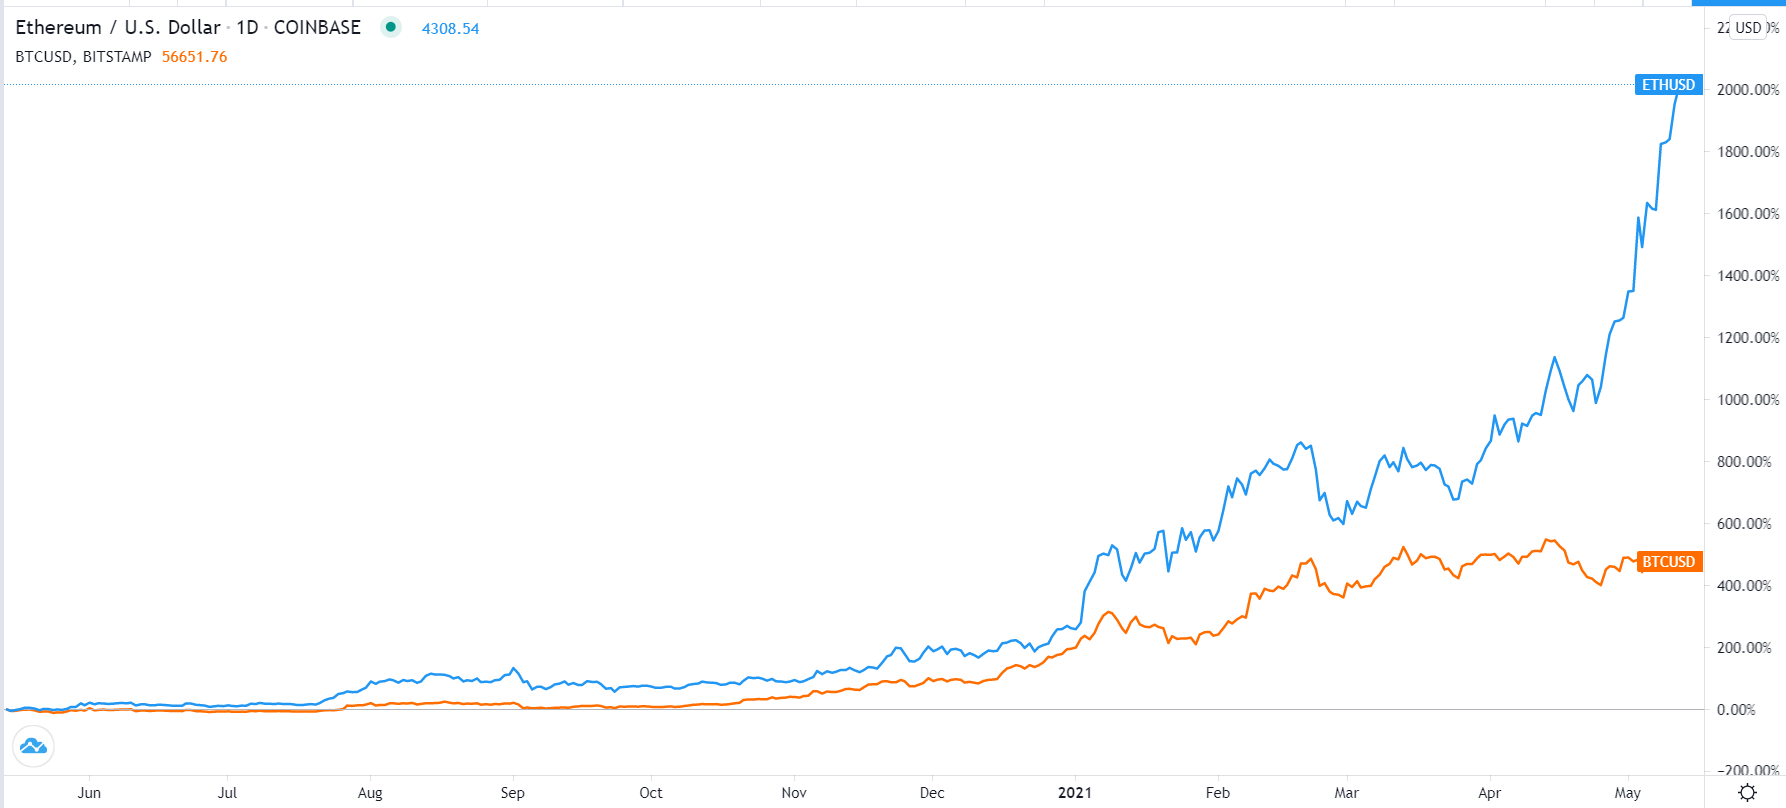
Ethereum price is hovering near its all-time high as demand for the network continues. The currency’s price has doubled in the past 30 days. Bitcoin, on the other hand, has struggled, having dropped by about 5% in the past 30 days. Indeed, Ether has also outperformed BTC by far in the past year. It has gained by almost 2,000% while BTC has risen by less than 500%.

Ether vs BTC 1-year chart
Bitcoin Has Lagged Ethereum
Bitcoin surged to an all-time high of $64,947 in April. It then declined by 27% to $46,988. Since then, the currency has struggled to retest its all-time high. Its recent attempts to retest these highs found a substantial resistance at $59,515.
Ethereum, on the other hand, also retreated in April after reaching its all-time high of $2,550. However, it managed to quickly recover and rise by more than 120% from its lowest level on April 15.
There are three reasons for the divergence between ETH and BTC. First, many retail traders view Ether as a more affordable asset to invest in than Bitcoin. This is because one Bitcoin can buy 12 Ethers. Therefore, since the two currencies have a close correlation, many investors believe that ETH is a better asset to invest in.
Second, the use case of Ethereum continues to expand. In the past few months, this growth was driven by Decentralized Finance (DeFi). This is an industry that is disrupting the financial sector by shifting control from a single source to the users.
In the past three years, the total value locked in the ecosystem has moved from zero to almost $90 billion. Analysts expect that this growth will continue in the next few years. Most of the biggest DeFi projects are built on Ethereum’s blockchain.
In the past few months, the use case of Ethereum has expanded into non-fungible tokens (NFT), which is another fast-growing industry. All this has pushed ETH and gas prices to a record high.
Third, while many institutions are buying Bitcoin, directly and indirectly, analysts see Ethereum as the next asset to watch. Recently, Jim Cramer, the respected host of CNN and former hedge fund manager said that he had bought Ether. Further, Grayscale Ethereum Trust has moved from a small part of Digital Currency Group (DCG) to become its second biggest. The GraySscale Ethereum Trust assets have risen to more than $12 billion.
Ethereum Price Technical Forecast
ETH has been on a strong upward trend as evidenced by the four-hour chart. The chart shows that ETH has formed an ascending channel pattern. It is currently slightly below the upper line of this channel. Also, the price is between the middle and upper lines of the Bollinger Bands. The upward trend is also being supported by the 50-day exponential moving average.
Therefore, while the upward trend will likely continue, the currency will probably have a healthy pullback as bears target the lower side of the channel. This prediction will be invalidated if the price manages to move above the upper side of the channel.
.png)
ETH 4-hour chart
Bitcoin Price Prediction
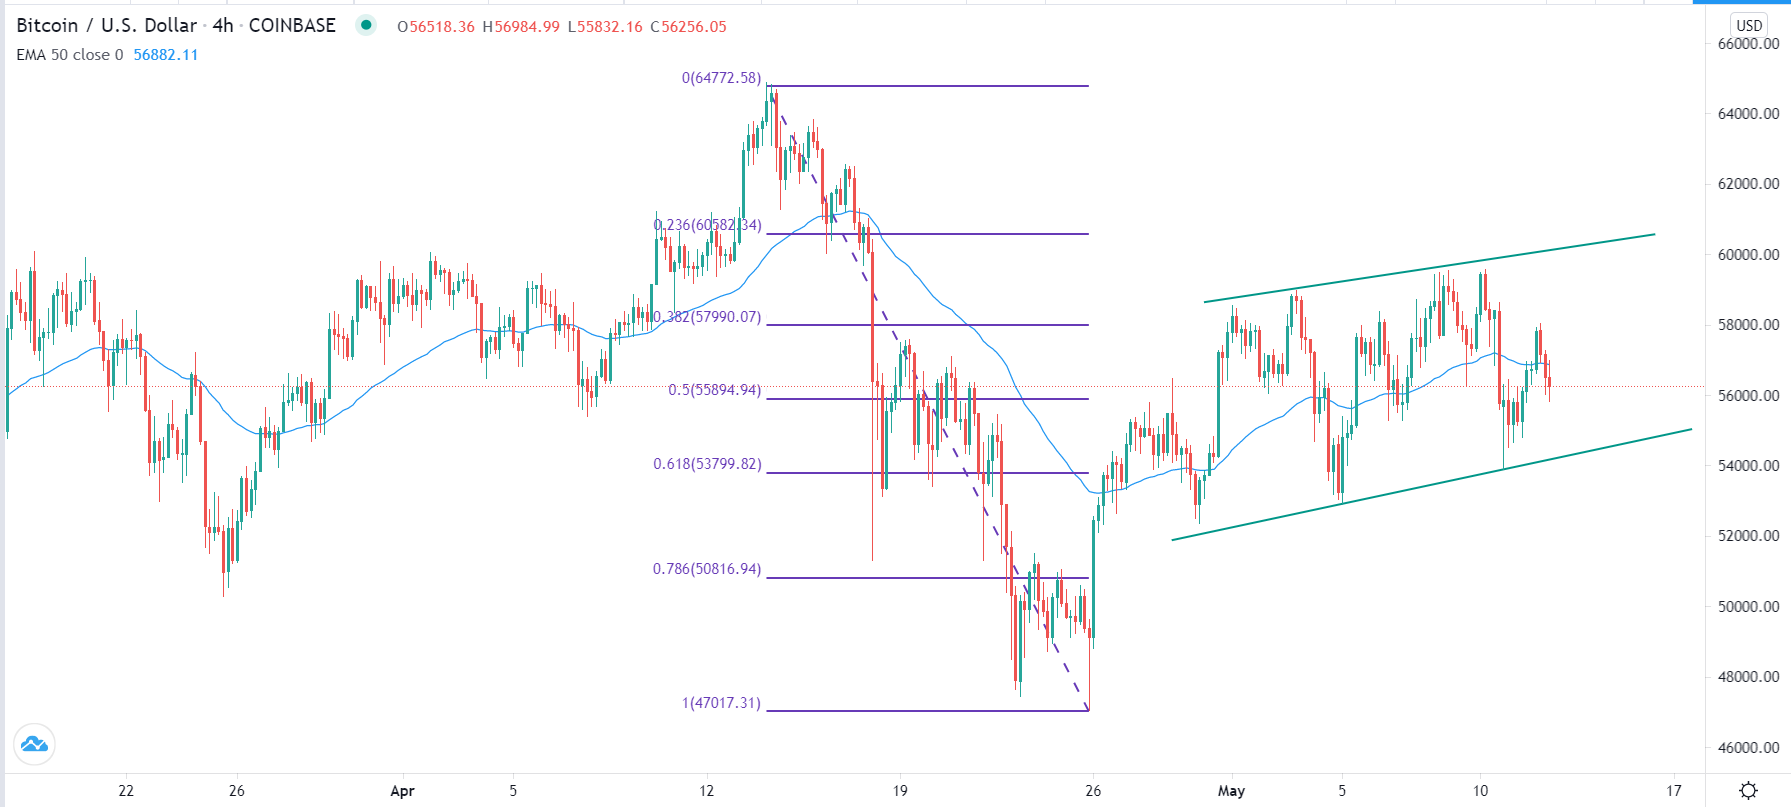
The four-hour chart shows that the BTC/USD pair has formed an ascending channel whose upper side is at $59,588 and the lower side is below $53,000. The price is hovering slightly above the 50% Fibonacci retracement level. It has also moved below the 50-day moving average. Therefore, the pair will likely retreat as bears attempt to test the lower side of this channel, which is slightly above the 61.8% retracement level.
 BTC 4-hour chart
