Market participants have been closely watching Bitcoin’s price action in the weekly timeframe to assess the asset’s price trajectory over the coming weeks. This comes amid a slight improvement in market sentiments and a strengthening market structure, pointing to further upside.
Does this suggest the Bitcoin bull cycle is back?
Bitcoin Supply on Exchanges Hits 7-Year Low
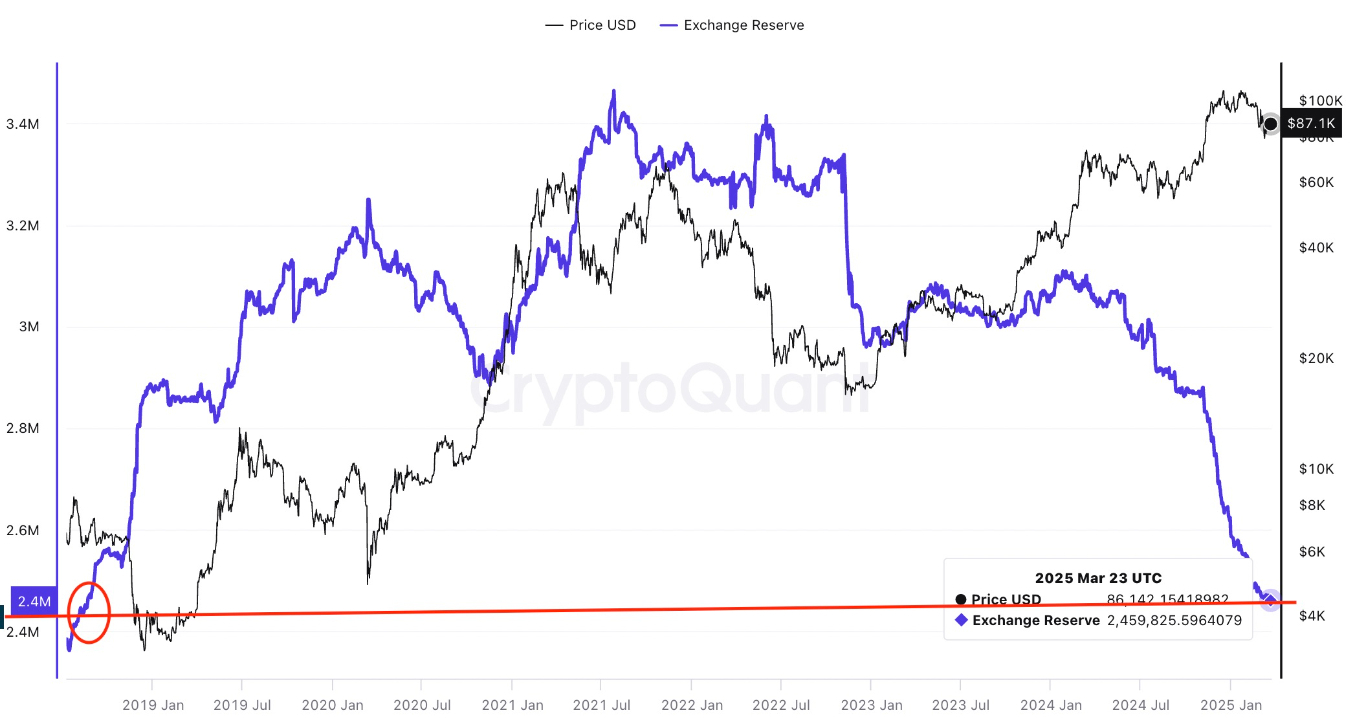
One of the clearest signs for a continued bull run eyed by crypto investors is a potential supply shock as Bitcoin reserves sink to a seven-year low amid continued institutional buying.
Bitcoin reserves across all cryptocurrency exchanges fell to 2.45 million BTC as of March 23rd, which marked a seven-year low not seen since June 2018, when Bitcoin was trading just above $7,000, CryptoQuant data shows.

Bitcoin exchange reserves. Source: CryptoQuant
The falling Bitcoin supply on exchanges can probably be attributed to continued discount buying by institutional participants.
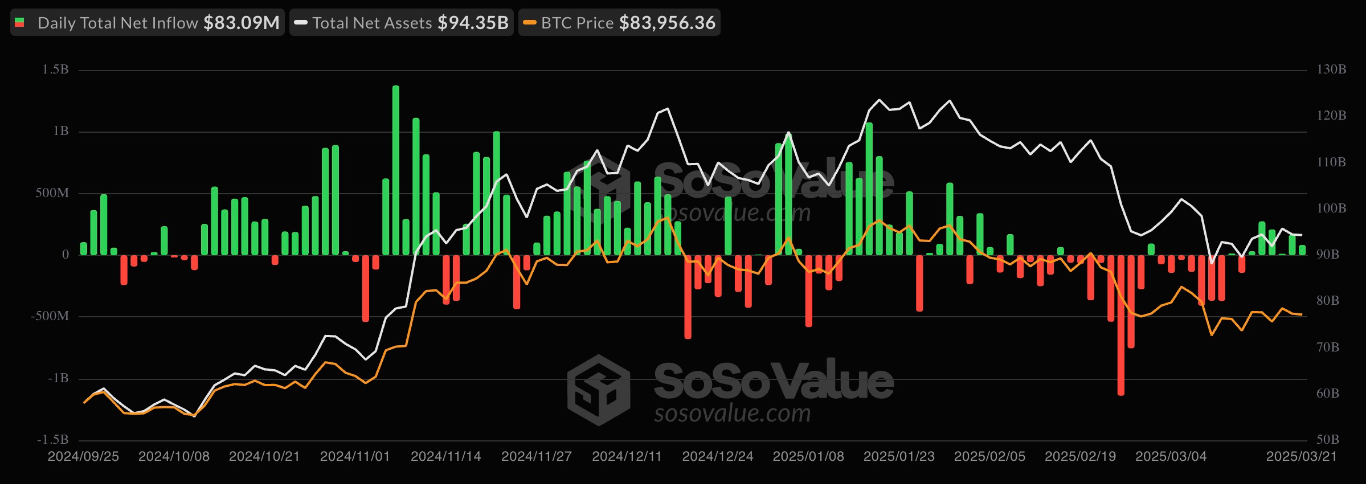
Most of these large institutions buy through spot Bitcoin exchange-traded funds (ETF) issuers. According to data from SoSoValue, US-based spot BTC ETFs have recorded positive flows for six consecutive days, totaling $785.6 million. This brings the total assets under management to $94.35 billion.

Spot Bitcoin ETF flows. Source: SoSoValue
Diminishing Bitcoin supply on exchanges may signal an incoming price rally driven by a “supply shock,” which occurs when strong buyer demand meets a decreasing amount of BTC, leading to more price appreciation.
Significant Improvement in Market Sentiment
The cryptocurrency market has seen a subtle but meaningful uptick in sentiment, providing a supportive backdrop for Bitcoin’s price rise. Over the past 30 days, the cryptocurrency market has witnessed a notable shift in sentiment, according to data from Alternative.me.
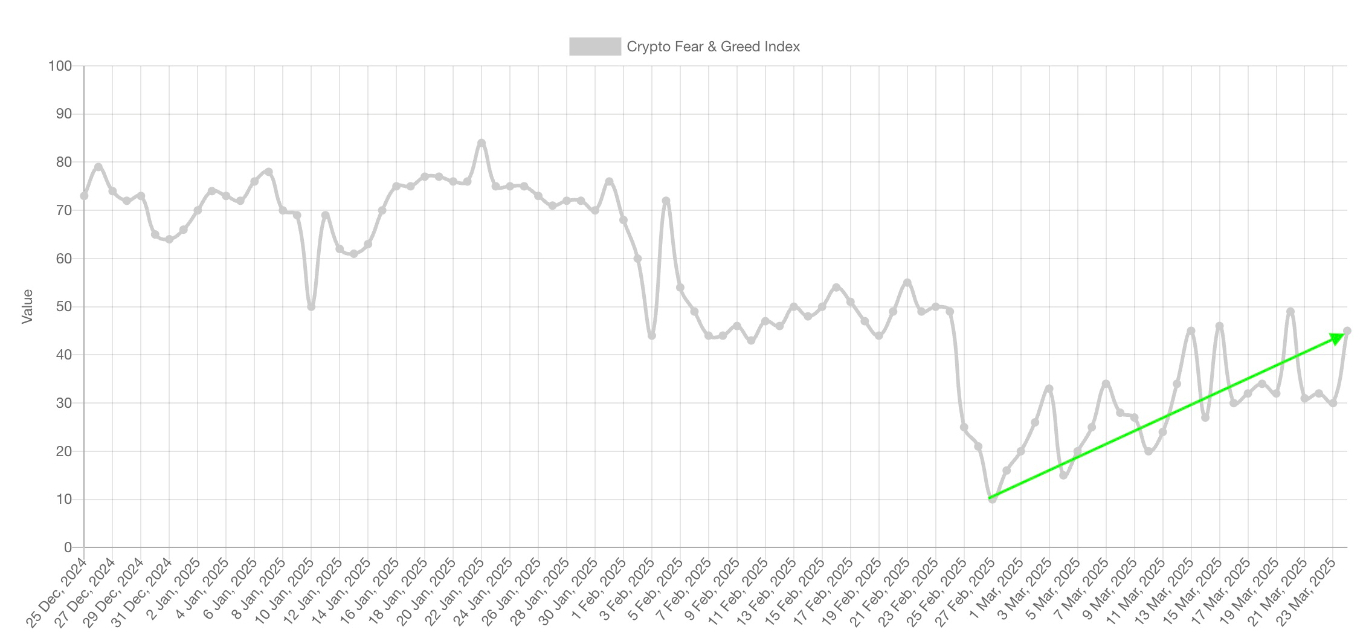
The drop in Bitcoin price saw the Crypto Fear & Greed Index drop to 10 as the market was gripped by extreme fear. Such scores are typically associated with oversold conditions and a reluctance to buy. As seen in historical cycles, the Bitcoin price often bottoms out in such environments.
The index has since climbed to 45, indicating a transition toward greed, where investors begin re-entering the market, driving demand and pushing prices higher.

Crypto Fear & Greed Index. Source: Alternative.me
This sentiment shift aligns with Bitcoin’s recent price gains, suggesting this rally has legs. Sustained trading volume increasing and reduced selling pressure further support this trend. While not yet in "extreme greed" territory (above 75), the current trajectory hints at continued upward momentum, provided macroeconomic conditions remain stable.
Bitcoin’s Giant Bull Run to $200,000
Despite the recent price correction, the BTC/USD pair is expected to resume its prevailing bullish momentum as it paints a classic technical structure with an upside outlook.
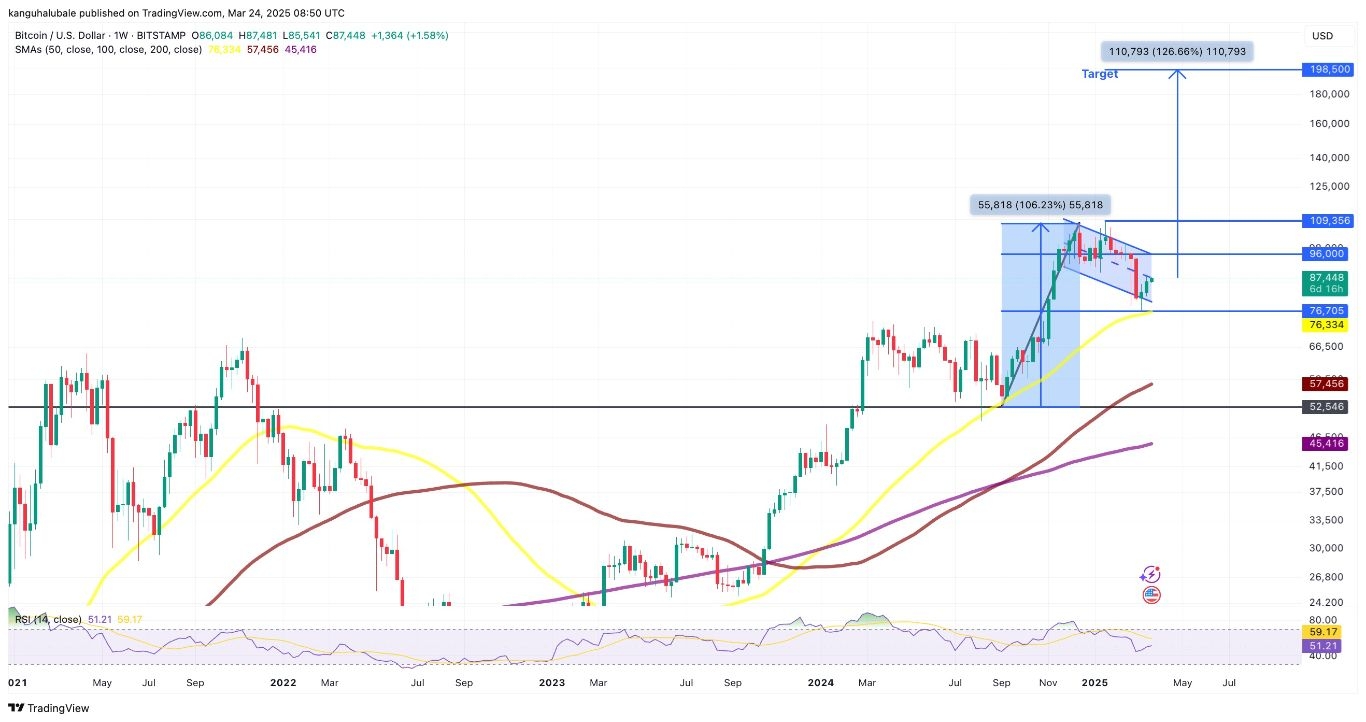
Dubbed a "bull flag,” the pattern forms when the price consolidates lower in a descending channel (flag) following a strong move upward (flagpole). Ultimately, the price breaks above the channel’s upper trendline, typically rising by as much as the flagpole’s height.
Bitcoin’s recent price action has led it to form a similar bull flag pattern, as shown in the chart below. As a result, its next attempt to break above the channel’s upper trendline could lead to its price as high as the flagpole’s height, which comes to be around $198,500, a 106% uptick from the current price.

BTC/USD weekly chart featuring bull flag pattern. Source: TradingView
BTC’s weekly relative strength index is facing upward after rising from 42 to 52 in a couple of weeks. This suggests that the chances of a continued rally are relatively high.
On the other hand, a retreat from $87,500 (embraced by the flag’s middle boundary) could see a retest of the flag’s lower trendline at around $76,700, where the 50-weekly SMA currently sits. Lower than that, the price could move toward the 100-weekly SMA at $57,500 or the base of the flag’s post at %52,500.
Ready to trade our Bitcoin analysis? Here’s our list of the best MT4 crypto brokers worth reviewing.
