by: FXSolutions
EUR/USD
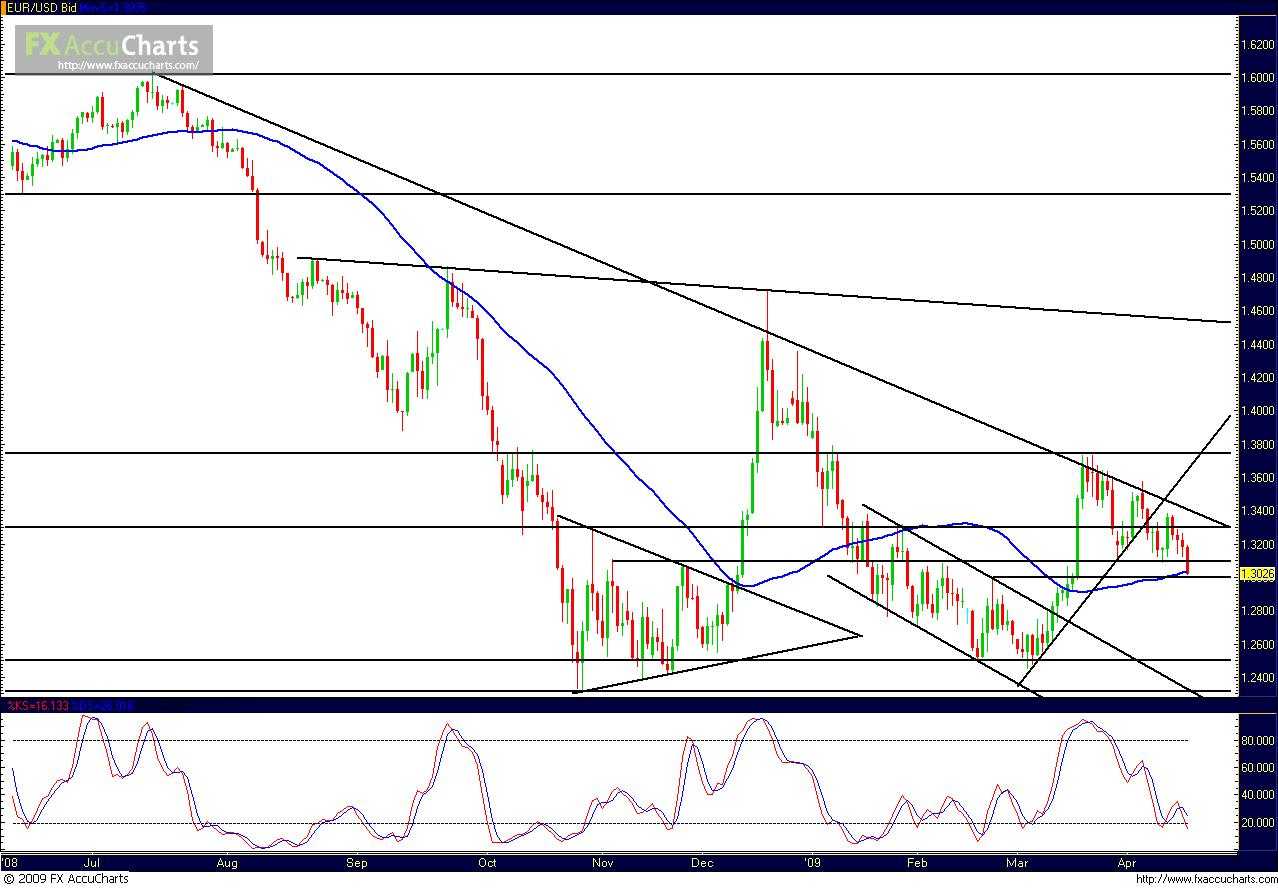
EUR/USD (a daily chart of which is shown) continued its expected bearishness for most of the past week after rising during the beginning of the week to approach once again the long-term downtrend resistance line extending from the second test of 1.6 back in July. Friday’s (4/17/2009) substantial bearishness broke cleanly below the key 1.3100 support/resistance level, and then closely approached the equally significant 1.3000 level before closing out the trading week. Price is currently at a critical juncture for the upcoming week of April 20-24, 2009. Any strong break below 1.3000 should signify substantial and continuing bearishness in the pair that could eventually target February and March lows in the 1.2500 price region. To the upside, the 1.3300 region and the noted long-term downtrend resistance line which is currently just above it, should serve as major upside resistance within the context of the current overall downtrend.

USD/JPY
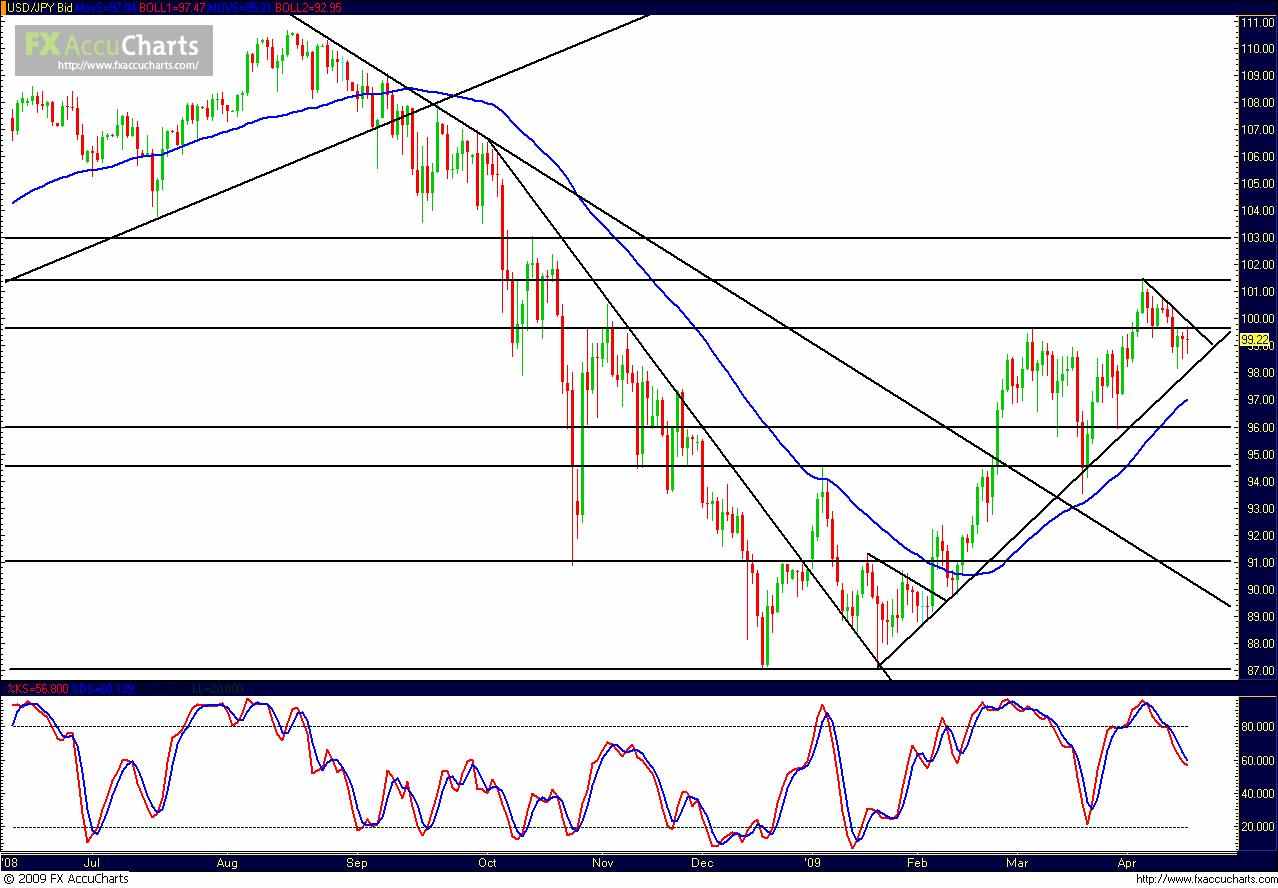
USD/JPY (a daily chart of which is shown) has continued this past week to follow a short-term bearish retracement line that has been in place since the 101.43 peak was hit early in the prior week. Currently, this pair is still entrenched in a clear uptrend, although the past couple of weeks have represented a retracement back to the key uptrend support line that has been in effect since the second test of the 87.00 double-bottom back in January. For the upcoming week of April 20-24, 2009, any breakout above the resistance offered by the short-term bearish retracement line should shoot for a retest of the current uptrend’s 101.43 high. And any subsequent breakout above that high could target further resistance around the 103.00 price region. To the downside, the noted uptrend support line should continue to provide strong dynamic support for the pair. In the event that it is broken to the downside, the key 96.00 level represents further major support.

