By: FX Solutions
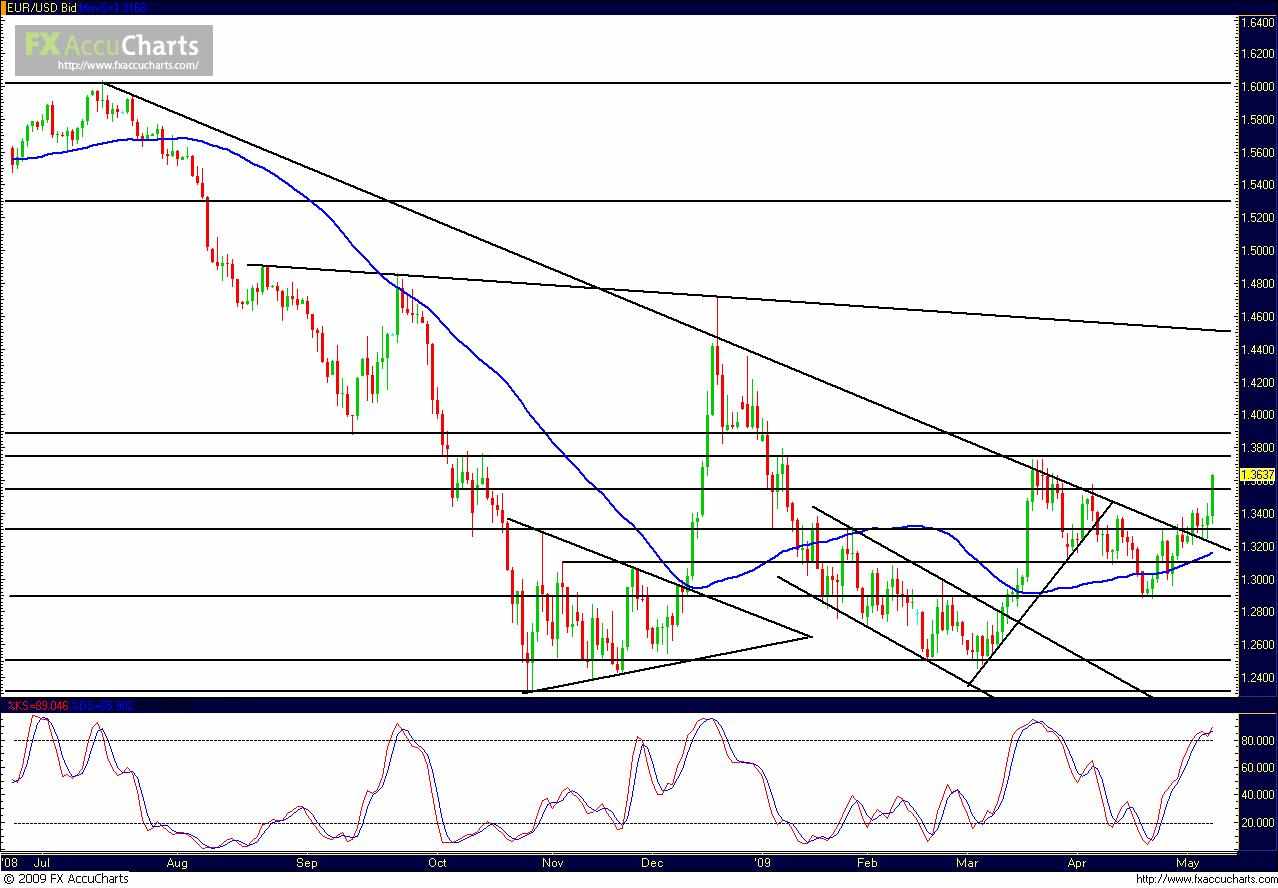
EUR/USD (a daily chart of which is shown) made a major bullish statement on Friday of this past week after consolidating aimlessly for the first part of the week. At the very beginning of the week, price had made a tentative breakout above the long-term downtrend resistance line extending from the 2nd test of 1.6 back in July, but then struggled to climb significantly above the 1.3300 price region for the next few days. Friday, however, saw a one-directional range of almost 300 pips as the pair rose decisively out of its consolidation. In the process, price is now confirming the trendline breakout that could potentially change the overall trend. For the upcoming week of May 11-15, the pair is approaching key resistance around 1.3750, which represents an important prior support/resistance level as well as the last major swing high. A breakout above that level would represent a significant confirmation of a new uptrend, and should target immediate further resistance in the 1.3900 price region. As the launching pad for the current bullishness, the 1.3300 price region should provide strong support for the pair going forward.

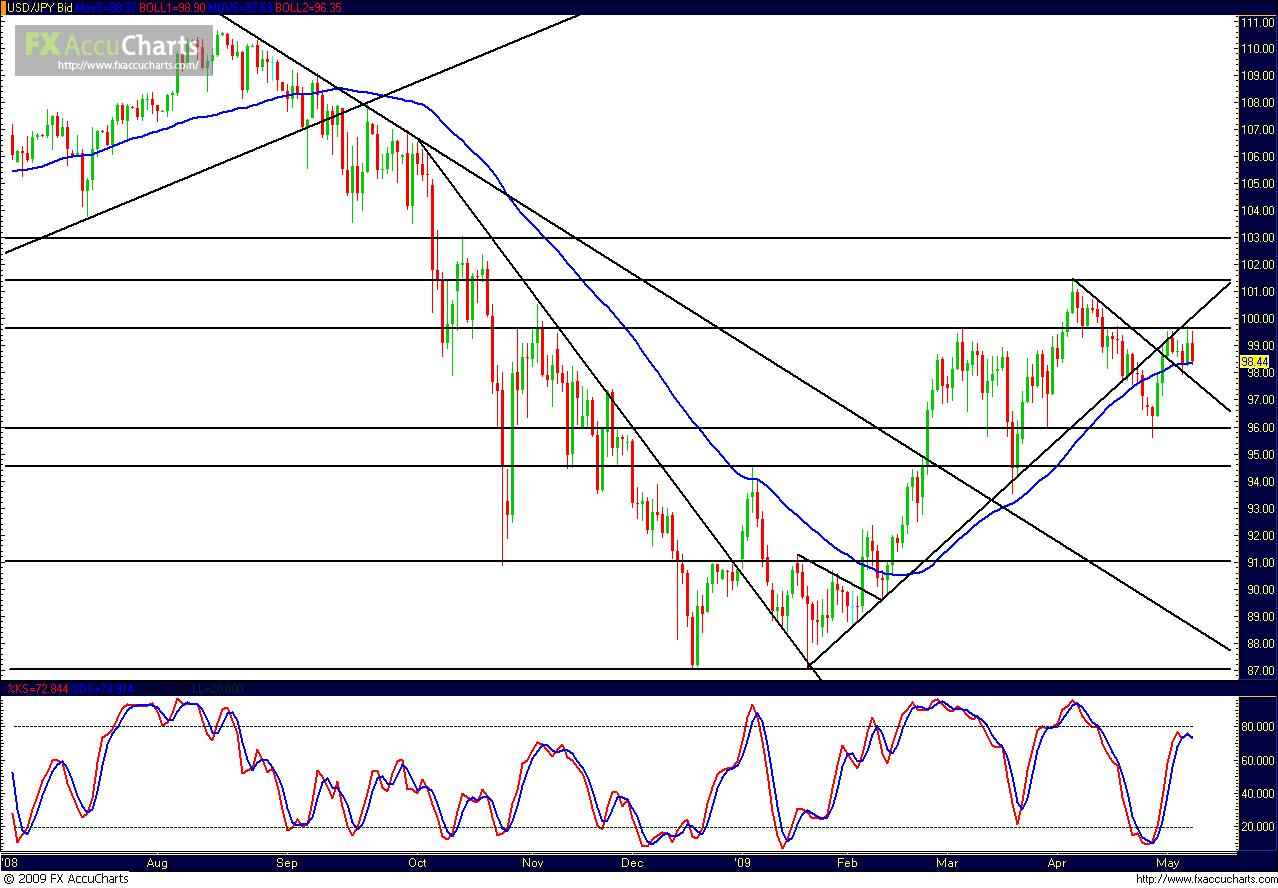
USD/JPY (a daily chart of which is shown) consolidated under strong resistance in the 99.55-99.75 price region for the entire past week. The fact that price reached for and was rejected at this price zone on several different occasions in the past week attests to its strength as an effective resistance barrier. For the upcoming week of May 11-15, the key support/resistance levels remain constant from the prior week, although the directional bias this time is leaning decidedly towards the downside. The major support target to watch for continues to be the 96.00 region, which has served so effectively in the past as a key pivotal level. Strong upside resistance continues to reside slightly below 100.00, with further upside resistance in the 101.43 region, the level of the last major swing high. If price indeed succeeds in making a bonafide turn down from below 100.00 during the upcoming week, and actually succeeds in re-testing 96.00, USD/JPY may potentially be in the process of forming a rough, intermediate head-and-shoulders top.

