
EUR/USD:
Most analysts were prepared for the EUR to go short once the EUR broke the 50 SMA, which had been holding support since April 2009. If you followed that advice you are doing great, except one issue. The EUR is 150 pips off its recent low. Did you miss the bottom or is this just a minor retrace?
There are 3 approaches you can take to answer the question: “Should I stay in the trade?” 1) You can purely look at the technicals. 2) You can monitor fundamentals to get a macro-economic sense of dollar strength or weakness. 3) You can do both 1 & 2. Obviously we recommend selection 3.
Let’s cover the Fundamental part of the equation. Negative news from the EUR zone will weaken the EUR while positive data from the U.S will strengthen the Greenback. The Short term trend is Dollar positive while the Long term trend is Dollar negative.
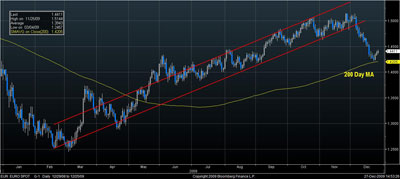
There are a number of different technical resources one can use to analyze the Dollar's recent retrace. The ones we want to focus on are tools that offer insight as to where the EUR may be heading, as opposed to some indicators which measure current momentum and the like (although those tools have their place as well). This will help us choose exit and (if necessary) reentry points. Start by stating what we can easily be observed. Firstly, the EUR has bounced off its 200 day MA, as seen in the chart below.
The next chart combines Fibonacci's with an Elliot wave. Both of these technicals rely on patterns or cycles. Since by definition a pattern or a cycle has a repetitive element then we can apply these technical tools in an attempt to decipher the EUR's next move. We have diagrammed the start of an Elliot Wave. Point A represents the culmination of the first leg of the move followed by a retrace as buyers and sellers realign their positions. Point B represents the point of continuity of the initial leg.
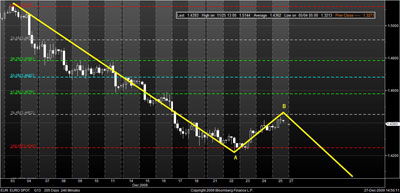
We also used the Fibonacci Projection tool. It places the 76.4% level at 1.4452, slightly above the current markets. However, the 61.8% level which conversely represents the 38.2% retrace is more significant to us because it represents a true breach of the pattern we rely on consisting of lower highs and lower lows. Therefore, a candle appearing above 1.4452 would exit us from the position. However, a bounce off of the 61.8% Fibonacci level would trigger a reentry if price action moves back below the 76.4% Projection level, or the exit price.
You need to allow for a certain amount of leeway and that is where fundamental knowledge of the macro environment is important. As you approach critical levels in either direction, price action from the fundamentals can bring your trade back around or stop you out. Using technical markers like a buoy, helps identify where you are in the life cycle of your trade. Otherwise emotional conviction will ruin it for you. Trading from emotion or greed will make profitable trades less profitable and your losing trades bigger losers.