
USD/CAD:
The Loonie flirted with Dollar parity back in late October of 2009. However, the BOC stepped in and expressed its dismay over the Canadian Dollar strength, issuing harsh statements that a strong CAD would stymie the economic recovery. Shortly thereafter the CAD lost nearly 6.5%. Now, on the heels of continued recent economic strength, higher oil prices, and a weakening Dollar, that CAD is looking to retest lows last seen in late October as the CAD races again towards Dollar parity.
On the chart below we use a 4hr time frame. A very clean step pattern is present with only one anomaly which can be discounted (yellow circle). Current price on the CAD is 1.0330. A Long CAD position has been triggered with the close of the candle coinciding with the U.S session close. A stop loss can be placed 2 steps above, at the 1.04 handle. As we are all aware, no pattern or system is without minor flaws and thus we allow for anomalies, which is why we use 2 steps above or the higher high as the stop.
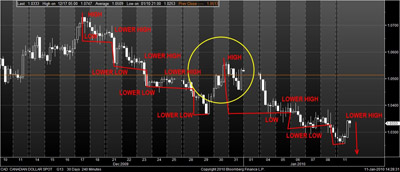
Entry points are critical. Anyone can spot a trend but if you enter a long position as the overall trend is hitting a minor retrace you can get stopped out. Even though your directional play was accurate your timing was not, therefore where you enter is just as important as spotting a trend. The 4hr chart gives us a good entry point, in part because it is close (but not too close) to our stop loss. The next chart which is a daily tenor shows us just where the CAD may be headed.
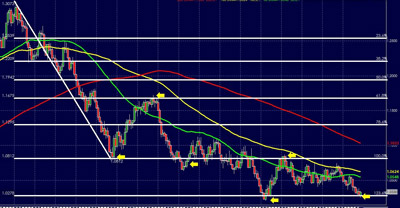
We used a Fibonacci Projection starting from the CAD high at 1.3073 back in March of 2009 to the 1.0783 handle struck in the beginning of June last year. The 61.8% level hit the immediate retrace that ensued with the June low, while the 123.6% Fibonacci Projection struck exactly at CAD resistance near 1.0243. Either the CAD will take out resistance and race towards parity, or it will bounce off resistance. Regardless, we will have profited as the CAD continues to appreciate. A weaker Dollar, higher oil prices, and positive economic data, for now are all pushing the CAD lower.