
USD/CAD:
The Loonie has been range bound against the Dollar since the beginning of November. When candlesticks move sideways for extended periods of time, trades refer to price as consolidating. In the chart below notice how the CAD went from trending to ranging to mini break out and then back to ranging. After an extended period of consolidation, expectations of a break out increase.
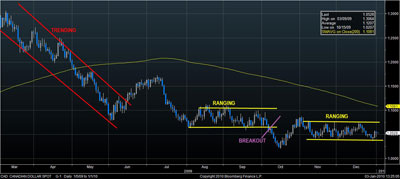
There are several ways to trade during ranging periods. The first approach is rather simple but can be highly effective. As the pair approaches its highs and lows of the, enter a reversal trade. Place your stop just above the high or low as the case may be. Leave some wiggle room as you do not want to be stopped out to easily.
As we mentioned above, the longer ranging continues the more anticipation builds for a break out play. The key to profiting from the break out is to define the level at which the market considers the price action warranted. There are several means by which this can be accomplished. Let’s start with the most basic approach. Draw horizontal lines representing the very high and low of the range. If a candle breaks the high or low with at least 1/3 of the candle body above/below the horizontal line then enter the position with a stop just above/below the horizontal line.
An addition to using basic Support and Resistance lines we also suggest utilizing Fibonacci and Moving Averages when possible. In this case, the Fibonacci resistance line (100%) at 1.0785, represents the high of the range while the Fibonacci 123.6% projection level represents the low of the range. (These lines are a tad wide of the actual high and low, but as always we allow for small variances.)
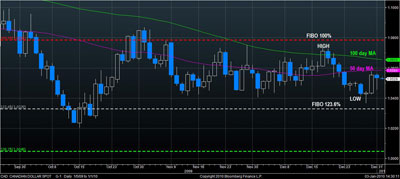
If you entered a Short CAD position when price bounced off of the low we would look for the next series of moves in price as confirmation to continue in the trade. A close above the 50 day MA followed by a close above the 100 day MA. If we see a close above the recent highs at 1.0750 followed by a breach of 1.0780, the Fibonacci resistance level (100%), then continue with the position. If that move is followed by a close above 1.0880, representing mid0term support for the CAD than 1.0990 is the next level we look to take profit at. If price retraces any of these intermediate moves we would close the position and look to enter a reversal near the high of the range as the break out may not be ready to materialize.