USD/JPY:
There were a number of great intra-day technical plays across the G10. We will focus on the Yen as it appreciated the most, gaining 1.31% on the Greenback. The price action is usually more substantial when a varied assortment of indicators, chart patterns, time frames, and oscillators all arrive at the same entry point.
We use a 4 hour time frame in the Chart below. The first tool we use is a Fibonacci Projection. Technicians can use Fibonacci's in many different ways. One method we use is to select a past low and high to see if it will generate accurate Support and Resistance levels beyond the 100% level. We use the JPY low of 84.83 reached in late November and the quick retrace high that ensued to 90.77 struck in early December.
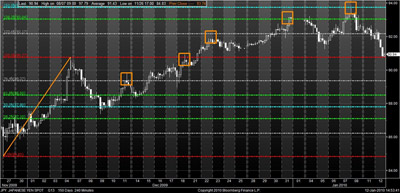
On the chart above we see that the Fibonacci Projection hit a couple of different levels of Yen Support, as indicated by the orange boxes. This is confirmation that the high and low used to generate the projection is a good predictor of key pivot points. The Yen support levels we mentioned above takes shape in the form of the Step pattern that we heavily rely on.
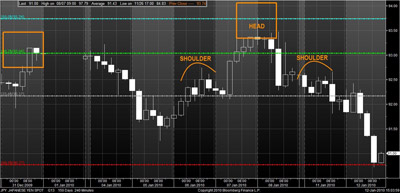
We next isolate a set of indicators, patterns, or the like that will help predict the next move. A Head and Shoulders (H&S) pattern finished forming today. The entry point tied in nicely with a break below the prior low as well as the Fibonacci's 123.6% level. The result was the JPY advancing nearly 130 pips. Notice that it bounced off the Fibonacci's 100% handle at 90.77, again reaffirming the validity of the Fibonacci high and low points used to generate the respective handles on the chart.