
EUR/USD:
The EUR has been very choppy since hitting its most recent low back on December 22nd. As traders reposition themselves for the start of this year we wait for new trends and correlations to emerge. In the interim we seek to find ways to generate PNL on intra-day moves using shorter time frames.
In the chart below we utilize a 30 minute time frame. In so doing, a head and shoulders pattern takes shape. We also like to confirm the move with other patterns and or indicators. Firstly, let’s identify the shoulders, neckline, and head as seen on the chart. The neckline almost perfectly coincides with the Fibonacci Retrace drawn from the December 22nd low at 1.4216 to the recent high at 1.4484.
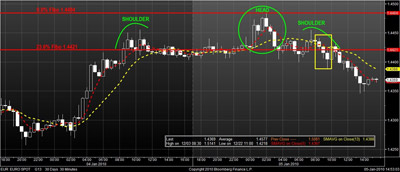
The next pattern that forms is known as 3 black crows, and is a bearish signal. Three consecutive candlesticks will open at the prior candle's close and it's close will be lower than its open. Additionally, each candle should be close is size. We first see this formation in the head of the of head and shoulders pattern. We see the same Japanese Candlestick formation take place by the right shoulder, as seen in the chart, in the yellow square box.
The last confirmation tool we used was a moving average cross. When a slower MA is above a faster MA, that is indicative of a falling price environment and vice versa. We are using MA's based on the Fibonacci sequence of numbers. The 8 SMA (dotted yellow line) is above the 5 SMA (red dotted line) as price crosses below the neckline.
When we combine this analysis it triggers a Short EUR entry at 1.4406. Price action has since pushed the EUR down as low as 1.4346. The entry signal is stronger when varying indicators and patterns are all pointing in the same direction at or near the same level.