USD/JPY:
The USDJPY has been the epitome of volatility over the last year. Much of that volatility arises from the Greenbacks recent (unofficial) appointment as the financing currency for the carry trade. Recall that the carry trade consists of borrowing in a currency in a low interest rate environment and using the proceeds to invest in a currency that is in a high interest rate environment. As the Bank of Japan (BOJ) prefers low interest rates to maintain a weak Yen (to boost exports), subsequently making it the financing currency of choice. However, when the Greenback became just as cheap to borrow as the JPY, traders shifted the carry trade to the Dollar.
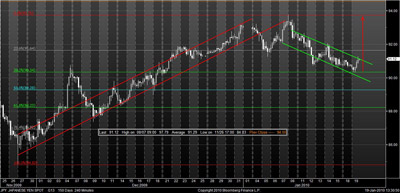
The JPY hit a low of 84.83 against the USD back in late November. The BOJ stepped in and pushed the Yen back up. We use that point along with the recent high set just over a week ago, at 93.77. to form our Fibonacci Retracement. In the Graph below you can see that the JPY just bounced off of the 90.36 handle, or the 38.2% Fibonacci level.

On the Graph above we have drawn 2 trend lines. The set in red represent the prevailing trend for now. The set in green are sometimes referred to as a Flag or Pennant. If there is a predominant pattern that breaks for a short period and then resumes, the interim period (retrace) is called a Flag or Pennant. It is this type of price action that continues to create the volatility in this pair. One additional data point to consider is demonstrated on the graph below.

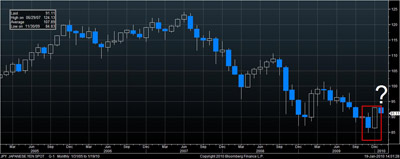
I referred to this as a data point because it would not fall under the guise of technical analysis, rather a statistical point of interest. Over the last 5 years when looking on a month by month graph, a positive price candle that is greater than the proceeding candle (which is negative in price action) has always been followed by another positive price candle with 1 exception. That exception still enjoyed a 500 pip gain before finishing lower. This might mean that the USD is at its low for the month, and it therefore may be a good time to buy the Greenback.
