By: Mike Kulej
Recently, currencies have been subjected to a series of wild swings in public sentiment. Seemingly, every few days the perception switches from a “flight to safety” to a “pursuit of risk”. One of the best examples of this wavering opinion is the AUD-JPY.
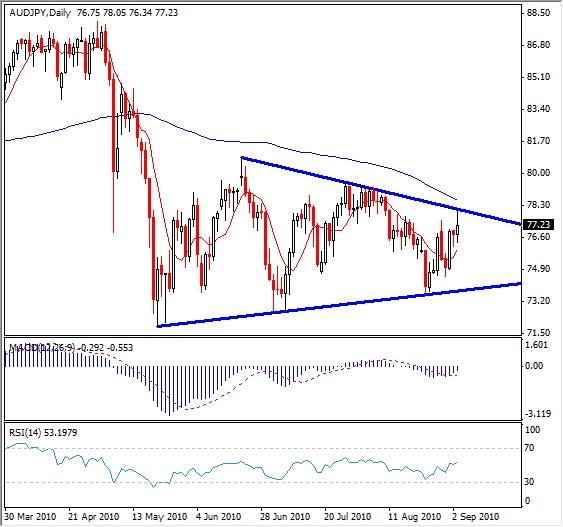
After making a low of 71.85 in May, this pair has been moving sideways all summer long. The highs are getting progressively lower, 80.85, 79.40 and 78.05, while the lows are becoming higher at 72.70 and 73.55.
On the daily chart, this price action is clearly building a symmetrical triangle, which, given the prolonged nature of this process, might even become a pennant by the time the new trend forms. Realistically, it should not be much longer before the price breaks out of this pattern, in either direction.
Since the preceding trend was down, the odds favor a bearish breakout, but both sides of this triangle ought to be watched carefully. Other technical indicators also lack direction. Both the MACD and the RSI support the trendless nature of the recent price action. The MACD oscillates near the zero line, while the RSI persistently remains in the mid range, all signs of a market setting up for a more decisive price swing.