By: Mike Kulej
Financial markets, including the currencies are having hard time finding direction. With the participants switching constantly between a “risk on” and “risk off” modes (at least that is media tells us), trends are either non-existent or hard to find. The GBP-USD is one of these markets.
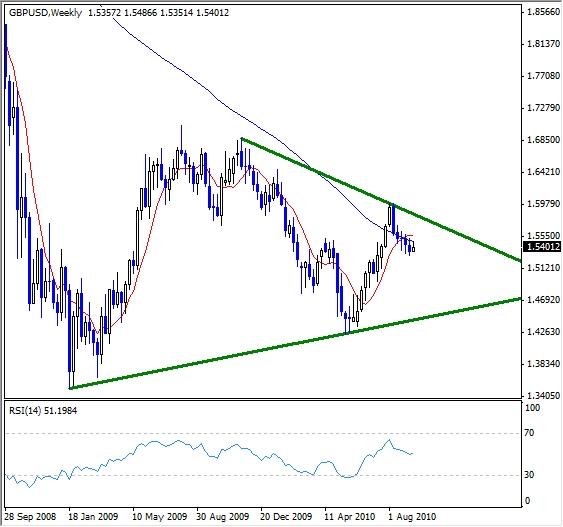
Both currencies in this pair are either loved or hated, resulting in sharp price swings. This is reflected in their relationship. On the weekly chart, the movements are getting progressively smaller. Currently, they are contained by two converging trendlines, effectively creating a triangle.
The price itself sits right on the 100 SMA, another sign of market indecision. Due to a very large scale of this chart, the GBP-USD will likely remain in a consolidation for some time. Any longer term trades should probably wait until this pair indicates its most likely direction by breaking out of the triangle.
The Relative Strength Indicator confirms this lack of direction. It has a neutral reading of 50, exactly in the middle of the scale and offers no real help in deciding what to expect next. More price development is needed for the RSI, and other indicators, to help with analysis again.

