By: Mike Kulej
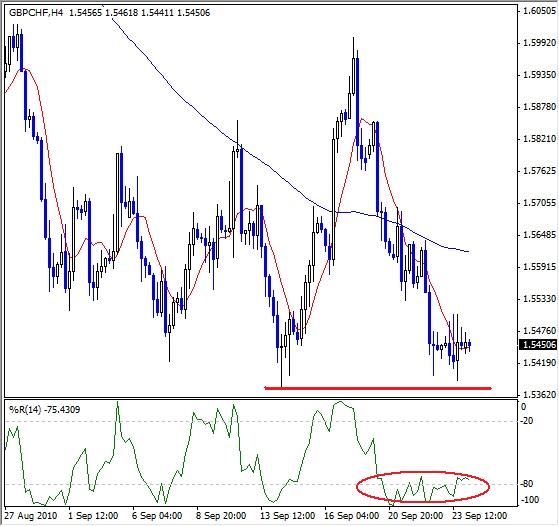
Starting in early September, the price action of the British Pound-Swiss Franc pair became very erratic. Every swing became larger than the one preceding it, only in the opposite direction, result of which is a chart with successive higher highs and lower lows. This pair seems unable to establish a trend of any duration, at least not on the intermediate term chart.
Currently, the GBP/CHF is once again close to previous low, but there are some differences. All of these recent tops and bottoms had very sharp turning points, something that is not happening right now. The volatility has disappeared, leaving a narrow range over last several time periods, as if the GBP/CHF was finding a support here. This raises a possibility of a double bottom chart pattern. A confirmation is needed, preferably a strong bullish candlestick formation. On the other hand, a decisive close under the 1.5375 previous low, would make the double bottom invalid.
The %R indicator has been showing an oversold reading for a while. During the time span covered by this chart, the oversold/overbought %R correctly identified every turning point. This increases the probability of the GBP/CHF finding support here thus confirming the double bottom.

