By: Mike Kulej
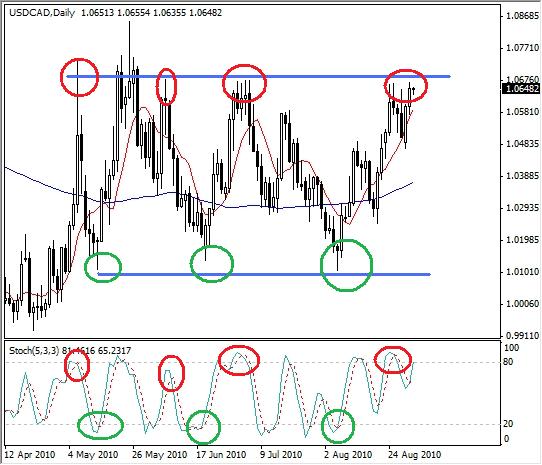
Over last few months, the USD/CAD has been moving sideways. It has not made any meaningful high or low since late May, when it reached 1.0852. Since then, the price oscillated in a range between 1.0680 and 1.0105.
Range bound markets lend themselves very well to technical analysis using oscillator type indicators. One of them is the Stochastic Indicator. Like most other technical tools, its exact readings depend on the settings, but in most cases it is a fast moving indicator, not lagging the price too much. This means that it reaches the “overbought” or “oversold” levels quickly, suggesting possible reversals. That characteristic happens to be tailor made for the range bound markets.
In case of the USD/CAD we can see how extreme readings in this indicator coincided with periods when the price tested the boundaries of the current range. They provided excellent entries for possible trades, both long and short. Nobody knows how much longer this sideways movement will continue; eventually there is always a breakout either way. However, until that time, watching the Stochastic Indicator at previous highs and lows should help traders remain on the correct side of the moves on the daily chart of the USD/CAD.

