By: Mike Kulej
Start of the week turned out to be rather directionless for most currencies. If anything, the moves went in opposite direction to the main trends, but nothing big, something that can be qualified as a “noise”.
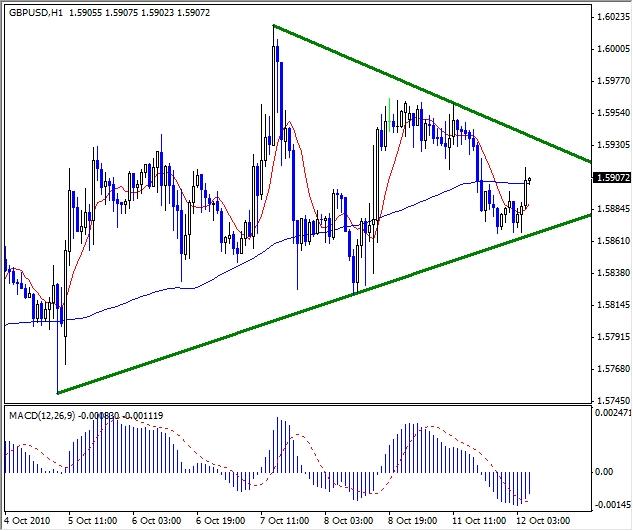
This type of market behavior often precedes bigger price swings. The GBP-USD is one of these currency pairs. On an hourly chart, its recent price action produced smaller and smaller swings, which are contained within a triangle.
The lowest point is at 1.5750 and the top at 1.6017. Lines connecting the highs and the lows form a symmetrical triangle. With the GBP-USD approaching its apex, a breakout should happen soon. Given a short nature of this chart (hourly), one could have a reasonable expectation for a move decisive price move on either Tuesday or Wednesday.
Symmetrical triangles do not offer clues about the direction of the breakout. In this situation an upside breakout should push the GBP-USD to the high of 1.6017. If the opposite happens, the price is likely to retest the 1.5750 low. Either way, these possible moves are relatively large for the short time frame involved thus worth watching.

