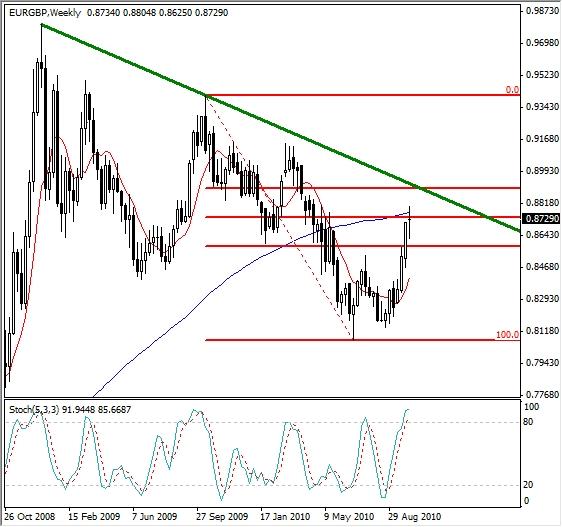
During the last few weeks, the EUR-GBP pair made substantial gains, appreciating from 0.8067 to 0.8804. It is a big move and it seems that a bull market is in force. However, a longer term chart suggests caution about the most immediate future of this pair.
On a weekly time frame, the Euro-Pound is still in a downtrend, even after this recent rally. The main trend is dictated by the down trendline, which remains above the price and provides resistance. For the downtrend to be broken, the EUR-GBP must move through this trendline. The latest candlestick is a doji, a possible reversal pattern, especially when it forms on a large magnitude time frame, like the weekly.
In addition, this recent rally placed the price right at the 50% Fibonacci retracement level, of the major price swing from 0.9411 to 0.8067. Reversals often happen at this and the 62% level. The presence of 100 SMA, adds another element of resistance here.
When looking at indicators, the Stochastic oscillator is severely overbought and showing a very high reading. Putting it all together, the weekly chart suggests a possible exhaustion of the bullish price run up and a resumption of the downtrend in EUR-GBP.

