By: Mike Kulej
Recently, the combination of a relative strength in the British Pound and the weakness in the US Dollar created a good size rally in their pair. The popular “cable” has been advancing since the start of the year, rising almost 1000 pips from the low of 1.5344.

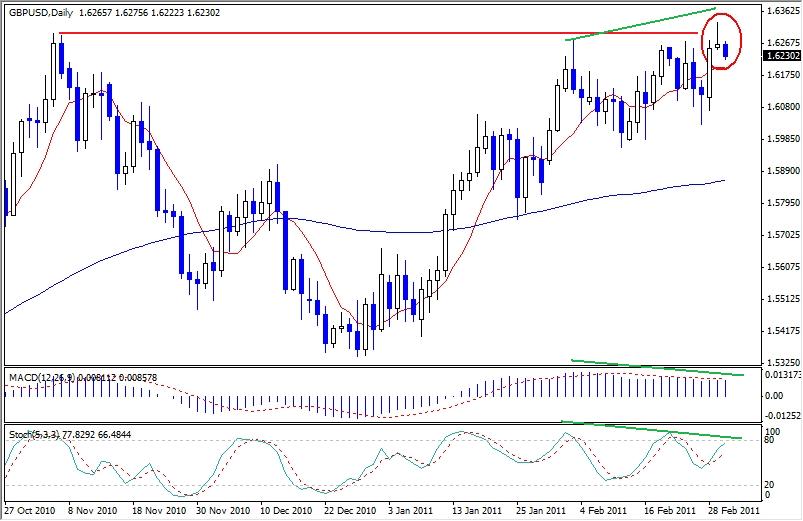
On Tuesday, the GBP-USD tested the resistance of 1.6300, set by a prior important high. One could say, the cable failed this test – it poked above the resistance, but retraced quickly and closed the day at 1.6265. In the process, the price formed a “shooting star” candlestick pattern, which has a potential bearish tone.
What it All Means
When formed after a well-defined, prolonged rally, this pattern often signals an end of the trend. However, it is better to wait for additional confirmation. On a purely price action bases, that should be in form of a strong bearish candlestick following the shooting star. So far, in early Wednesday trading, we can see a start of one, but the entire day must close lower.
Other technical indicators are also suggesting that the current rally may be a little overextended. Both the MACD and the Stochastic indicator are in divergence with the price, a bearish sign. When put together, the daily chart suggests at least a correction in the GBP-USD, but we should get even a better picture after Wednesday.
