By: Mike Kulej
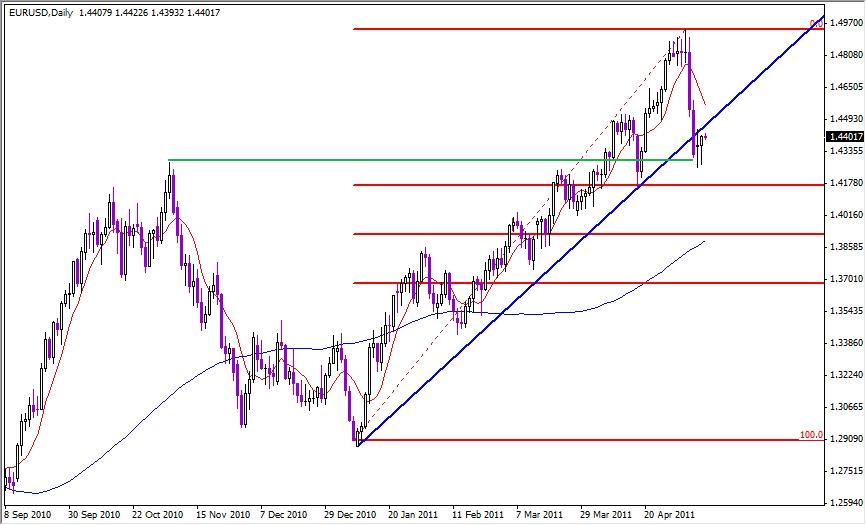
The EUR-USD has been in a strong uptrend since the beginning of the year, advancing from 1.2872 to 1.4939. For a while, it looked like this pair was going to test the high of 1.5140 established in late 2009. However, last week the price fell, collapsed rather, by about 700 pips.
This move pushed the EUR-USD under the main trendline on the daily chart, putting the uptrend in question. Closing on the other side of the trendline is often a first sign of a reversal. For now, the price stopped at 1.4307, which also happens to be a support established by a previous high in November last year.

If the EUR-USD climbs back above the trendline, the uptrend will probably be preserved for now. On the other hand, if the support of 1.4307 is broken, the price should continue lower, perhaps even much lower. Using the Fibonacci retracement levels, we can try to estimate possible objectives if the slide goes on.
The most common Fibonacci levels are the 38%, 50% and 62%, which are, respectively, at 1.4160, 1.3910 and 1.3660. As of right now the 1.3910 seems most likely, because of the confluence with the 100 SMA. For the moment, though, we must see if the EUR-USD stays under the trendline.

