By: Mike Kulej
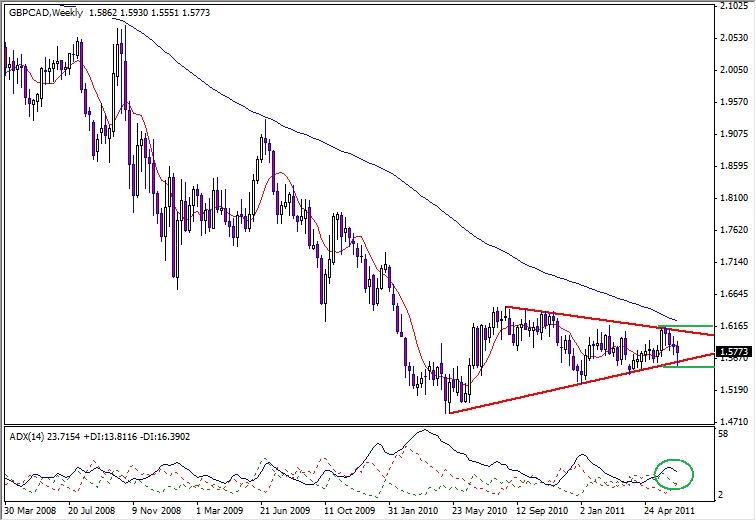
The British Pound is typically a rather volatile currency. Most of its crosses have large daily ranges and easily identifiable trends. The GBP/CAD is not much different with one possible exception – its very long-term chart shows a tight consolidation.
Of course, the “tight” distinction is only correct in the context of the weekly chart. Nonetheless, the GBP/CAD has been moving sideways for over a year now, in a clearly defined consolidation process. The price swings have been getting progressively smaller, which created a long pennant. Some could argue that this is a triangle, but given how long the current pattern has been under development, calling it a pennant is correct.

As the price approaches its apex, we can expect a breakout, which will start a new trend in the GBP/CAD. Only, which way? Probabilities favor a resumption of the downtrend, but since it has already lasted for years, this outcome may be difficult to accept. Instead of predicting the eventual direction of the next major price move, it might be better to wait until the market indicates where it wants to go.
For that, we can watch the most recent high and low, which are at 1.6145 and 1.5550 respectively. If the price closes outside of the pennant and either one of these two levels, the new trend may well be under way. That could send the GBP/CAD on a move several hundred, even thousands pips, especially if confirmed by a rise in the ADX indicator.
