By: Mike Kulej
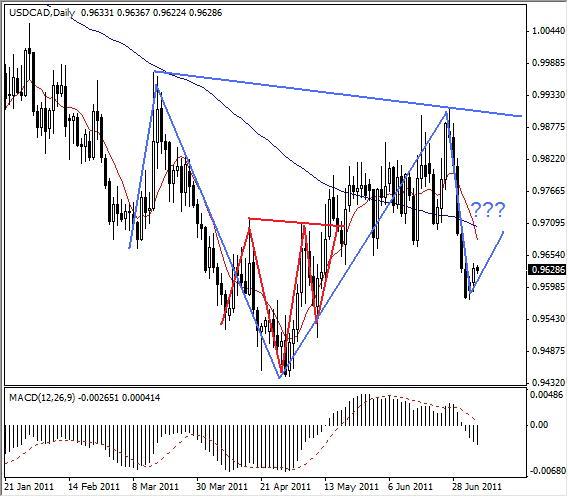
At present, the daily graph of the USD-CAD must be one of the least attractive looking charts of major currencies. After reaching a low of 0.9444, the price turned north and slowly proceeded to 0.9911, before selling off sharply about 325 pips. This drop was rapid for a change.
The overall behavior of this pair does not offer many clues about what the price might do next. However, when we look at highs and lows we can identify certain patterns. For example, the low 0.9444 is the Head of a small inverted Head and Shoulders formation, which projected the move to the recent high of 0.9911.

If we zoom out, we can see a possible much larger inverted H&S under development. The Head is still at 0.9444 but the Shoulders are at 0.9667 and 0.9578 respectively, with the two highs, 0.9966 and 0.9911 providing the Neckline. Together, we have a possible double inverted H&S pattern.
Obviously, the second, larger H&S is not complete yet. For that, the price will have to rally above 0.9900 again. If it happens, though, the USD/CAD could make an important, longer-lasting bottom. It is just one of possible developments in this pair, but it is plausible and worth following.
