By: Mike Kulej
Historically, the British Pound and its pair with the US Dollar, the popular “cable”, have been among the most volatile of all currency pairs. Recently, though the GBP/USD does not move as much as it once did. These days, even the EUR/USD has better daily trading ranges.
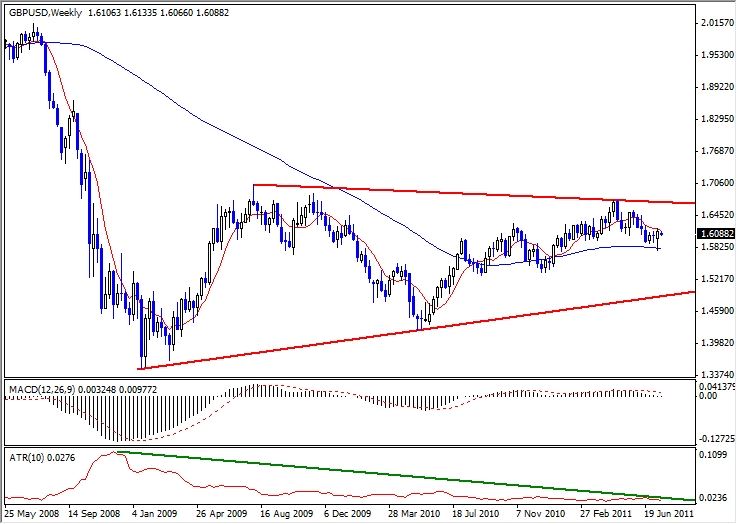
This process of contraction is probably best visible on the weekly chart of the GBP/USD. Following the panic of 2008, when this pair had dropped all the way to 1.3545, the price has been moving largely sideways. We can see how the movements have been getting smaller, with falling ATR.

The current Average True Range reading for this chart is the lowest in years, showing 275. In addition, the MACD also oscillates around the zero line, which confirms this trendless environment. Because this situation can last for many more weeks, perhaps months, those who trade trends should probably look for opportunities elsewhere.
Of course, that does not mean that the GBP/USD will remain like that forever. Eventually, the volatility will return prompting this pair to start moving in line with, or closer to, its historical norm. Until such time, shorter-term charts of the GBP/USD are a better choice.
