By: Colin Jessup
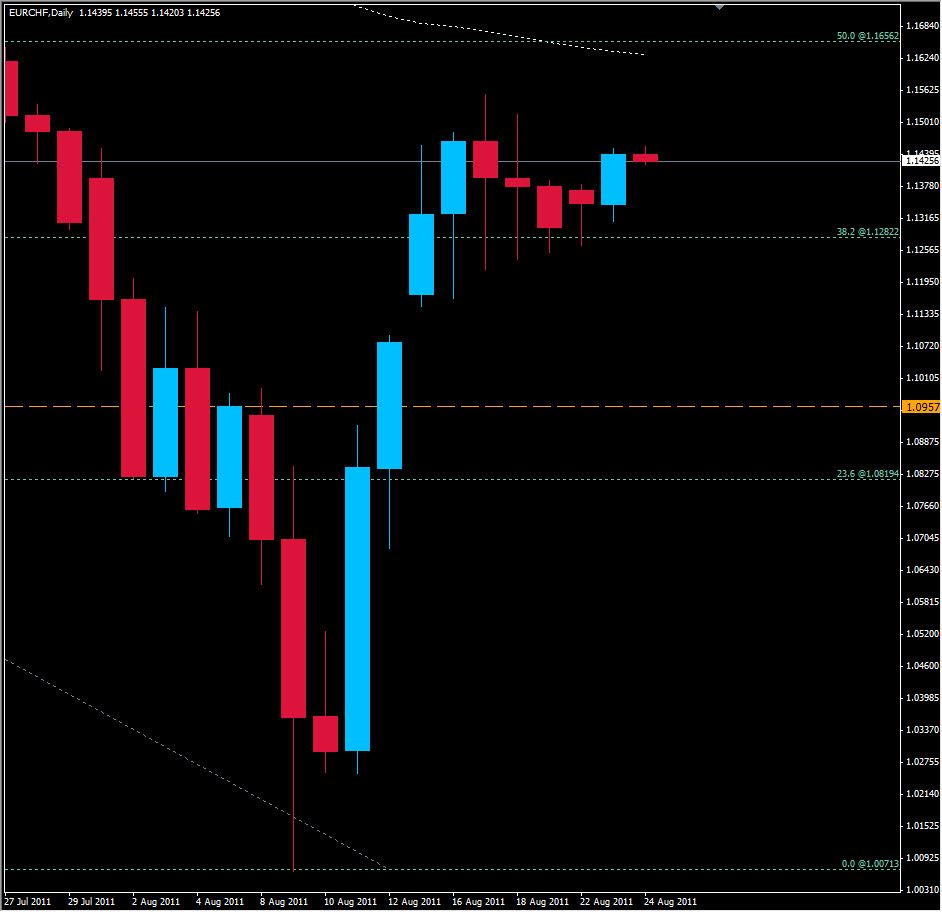
The EUR/CHF has been somewhat sideways for the past week after the pair turned bullish on August 11 and was pushed almost 1500 pips upwards. Since then, as with most of the other pairs in Forex, we have seen little movement. These tight ranges sometimes form a pattern that I often talk about and have mentioned its formation on several pairs this week...the flag formation, and in fact we see another daily bull flag on this pair. Today's price action was bullish as well breaking the short term descending trend-line which forms the top of the axe
There is resistance at 1.1554 with support at the 38.2% retracement level of 1.2810. If price breaks through resistance we will probably see a run to the 50% level at 1.1655 which also intersects with the 62 EMA and 1.1833 after that. Price could quite possibly turn bearish at this level. Should the support at 1.12810 break look for price to free fall all the way to 1.0950 as there is a technical vacuum below that support level which will pull price down like an apple falling from Newton's tree.

The weekly and monthly charts are both printing bullish candles with this being the third week in a row that price is trading higher than it opened the week. Price action formed a hammer off of the 1.0069 level 3 weeks ago, and closed above resistance at 1.0957. Since then price has continued its bullish move with a 3 week high at 1.1554 indicating that the bears have not been able to corral the bulls.

