Start Trading Now Get Started
Table of Contents
Affiliate Disclosure
Affiliate Disclosure DailyForex.com adheres to strict guidelines to preserve editorial integrity to help you make decisions with confidence. Some of the reviews and content we feature on this site are supported by affiliate partnerships from which this website may receive money. This may impact how, where and which companies / services we review and write about. Our team of experts work to continually re-evaluate the reviews and information we provide on all the top Forex / CFD brokerages featured here. Our research focuses heavily on the broker’s custody of client deposits and the breadth of its client offering. Safety is evaluated by quality and length of the broker's track record, plus the scope of regulatory standing. Major factors in determining the quality of a broker’s offer include the cost of trading, the range of instruments available to trade, and general ease of use regarding execution and market information.

EUR/USD - US Economics Weaker Than Expected

By Colin Jessup
Colin Jessup is certified in both Securities & Technical Analysis from the Canadian Securities Institute, founder of Omegatrader Canada and a Live Trading Coach at TheTradingCanuck.com, a service that calls live trades to captures dozens of pips daily with low drawdown.

By: Colin Jessup

The Euro was confined to narrow ranges ahead of the US open on Monday with resistance close to the 1.43 level as investors remained tentative over conditions, but the currency then advanced strongly in the New York Session.
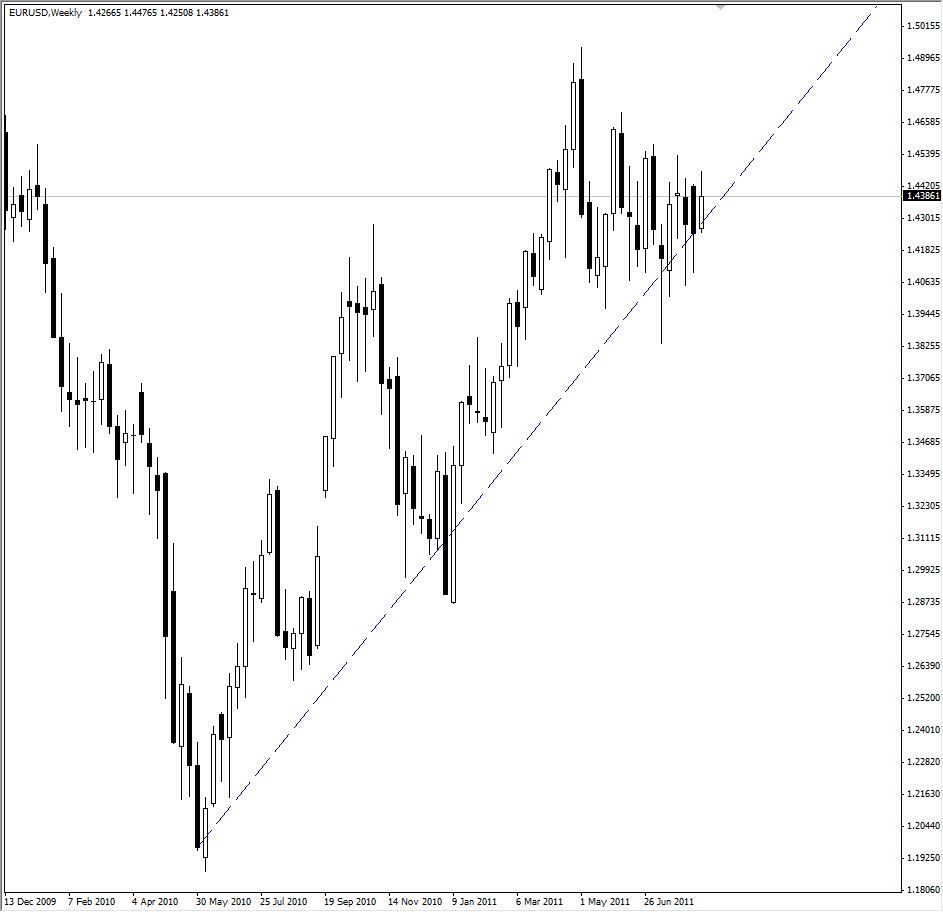
EUR/USD Weekly Chart, August 17, 2011

Now the EUR/USD appears to be setting itself up for a nice upward move towards 1.4580 level. Resistance can be seen around 1.4465 with most traders focussed to buy EUR/USD on dips and key retracement level around 1.4320. Both the long term and intra-day traders will be aiming to buy initially around 1.4320 level where we have an ascending trend-line going as far back as May 2010. If the EUR/USD extends it retracement below that level however, then the bears may take over and the next target will be 1.4235, providing good opportunities for averaging out both the entries. Also of interest is that the weekly candle chart has formed something of a flag, also known as an axe or a hatchet formation.

Looking at the different moving averages being used in the daily charts, it can be seen that the medium term and short term moving averages are looking to cross long term moving average and sneak above the long term moving average. Thus the overall scenario is looking good for a start of long term upward move. The lines are expected to cross around 1.4320 level adding to the importance of this level. The RSI in daily charts is just above 53 level and seems that it is also nicely placed for supporting an extended move towards 1.4580 level.

Colin Jessup
Colin Jessup is certified in both Securities & Technical Analysis from the Canadian Securities Institute, founder of Omegatrader Canada and a Live Trading Coach at TheTradingCanuck.com, a service that calls live trades to captures dozens of pips daily with low drawdown.

Most Visited Forex Broker Reviews