Start Trading Now Get Started
Table of Contents
Affiliate Disclosure
Affiliate Disclosure DailyForex.com adheres to strict guidelines to preserve editorial integrity to help you make decisions with confidence. Some of the reviews and content we feature on this site are supported by affiliate partnerships from which this website may receive money. This may impact how, where and which companies / services we review and write about. Our team of experts work to continually re-evaluate the reviews and information we provide on all the top Forex / CFD brokerages featured here. Our research focuses heavily on the broker’s custody of client deposits and the breadth of its client offering. Safety is evaluated by quality and length of the broker's track record, plus the scope of regulatory standing. Major factors in determining the quality of a broker’s offer include the cost of trading, the range of instruments available to trade, and general ease of use regarding execution and market information.

USD/CAD - Axe Formation on the Daily Chart

By Colin Jessup
Colin Jessup is certified in both Securities & Technical Analysis from the Canadian Securities Institute, founder of Omegatrader Canada and a Live Trading Coach at TheTradingCanuck.com, a service that calls live trades to captures dozens of pips daily with low drawdown.

By: Colin Jessup

The Loonie gained some serious ground today against the Greenback, a result of the volatile action in the USA & Global markets. The Philly Fed Index, which measures regional manufacturing numbers and is considered to be a solid indicator of economic conditions, as well as jobless claims in the USA both reported disappointing numbers. Meanwhile, the outlook from Canada's Leading Index and Wholesale Sales reports was at least positive. These factors combined resulted in a 134 pip spike as the daily candle shows.

From a technical standpoint, we have an axe formation on the daily chart which has been forming for the past couple of weeks. Price action today obliged us with a strong bullish move off of the daily support zone at 0.9796, which happens to be the 'tip' of the axe formation. The 100 EMA has also crossed above the 62 SMA which helps to strengthen the bullish sentiment of the pair. In addition, a descending trend line (also now acting as support), has met with the daily support zone at 0.9796. A bullish engulfing candle formed over the past 24 hours, which has almost completely overshadowed the last 5 days price action.
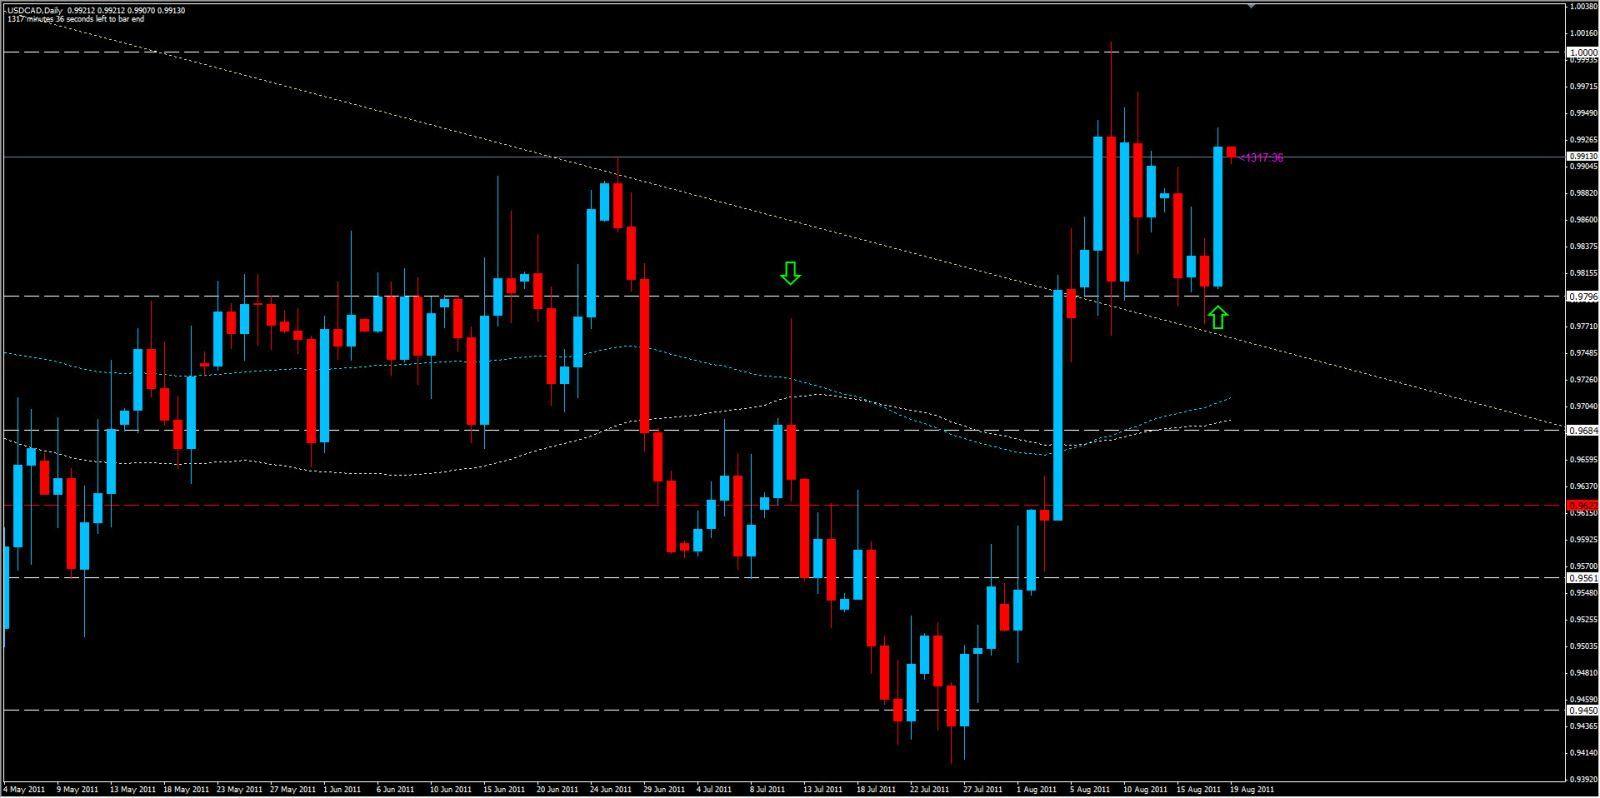
USD/CAD Analysis, August 19, 2011

If this pair continues to climb or closes above 0.98823 tomorrow, it will mark the 4th week in a row that the Loonie has gained ground on its southern cousin, reflected best on a weekly candle chart. The bulls are keeping this one afloat, but if price breaks below key support at 0.9796, we will see some support again at 0.9756 and then most likely a free fall to 0.9680 area.

It could just be a matter of time before we see parity on the USD/CAD again.

Colin Jessup
Colin Jessup is certified in both Securities & Technical Analysis from the Canadian Securities Institute, founder of Omegatrader Canada and a Live Trading Coach at TheTradingCanuck.com, a service that calls live trades to captures dozens of pips daily with low drawdown.

Most Visited Forex Broker Reviews