By: Colin Jessup
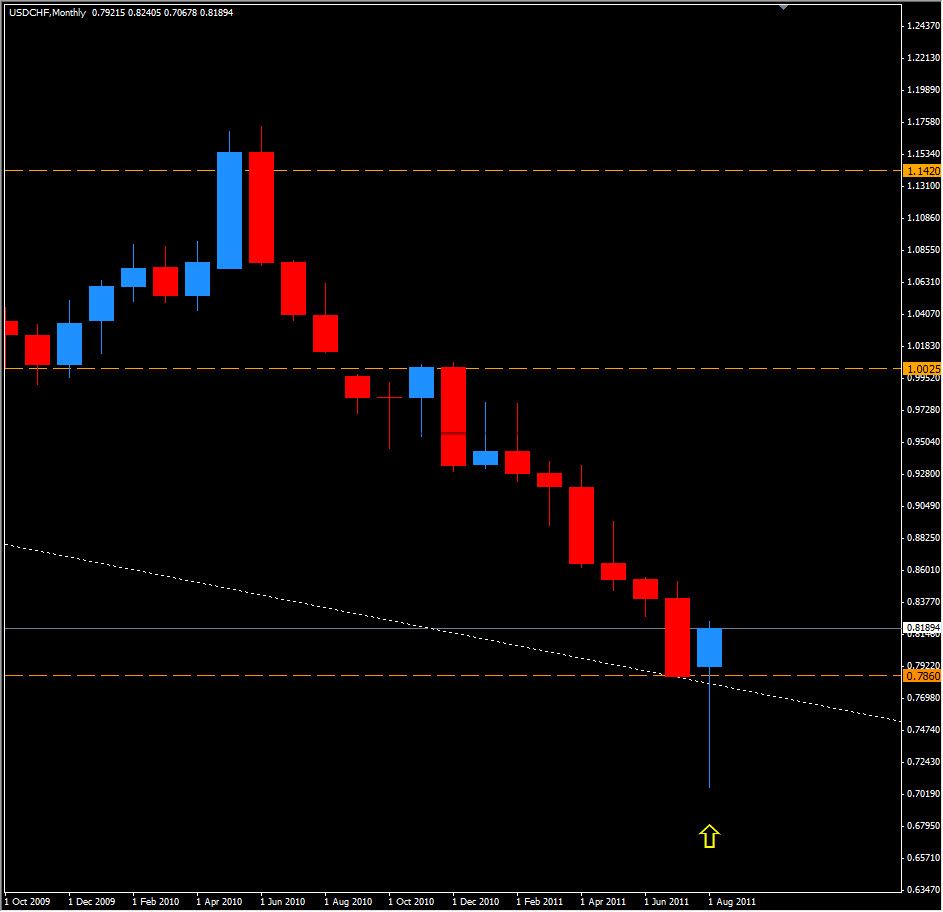
Today we take a look at the USD/CHF or 'Swissy' as most traders refer to it. While we still have some time left in August, when looking at a monthly chart, we have a very nice Bullish Long Shadow (or Hammer) which seems to have found support at roughly the same area as last month closed, 0.7850. This candle is 1173 pips all on its own, dwarfing the range of any previous monthly candle having formed in the last 12 months. We also have a confirmed descending trend-line which goes back at least to 2004, and intersects at the same support level 0.7850.
If the Swissy continues its recent bullish trend, we can expect to encounter major resistance at 0.8650 and 0.9350 above that, should it turn bearish and break the support zone at 0.7850 we will most likely be aiming for a wick-fill and can expect to encounter major support at the previous low of 0.7067.
Moving to a lower time frame, say the daily chart: We are trading right on a support zone at 0.8150, with resistance above at 0.8275 & 0.8310. If 0.8150 holds we can expect to see 0.8350 and 0.8500 not long after. Adding to the bullish sentiment is the fact that the Swiss economy only grew by 0.3% this quarter and another quarter of slow growth is expected. There fore, if the European Debt Crisis is kept in check I will remain bullish on the Swissy.
Happy Trading!


