By: Doug Rosen
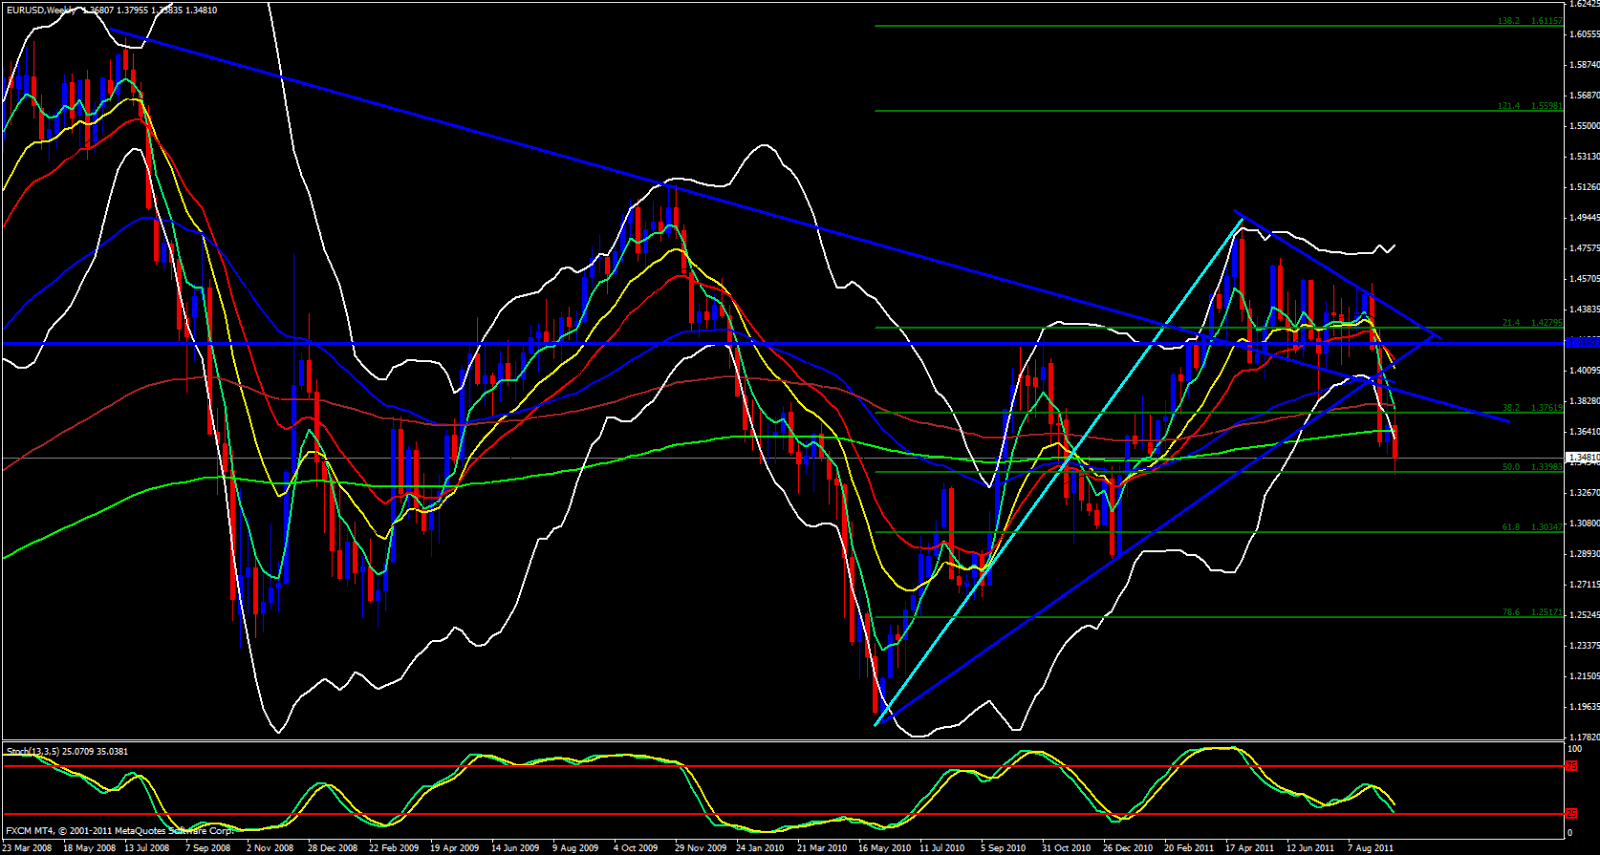
EUR/USD pair continues to look bearish and I don't see any reason why that will change anytime soon. On the weekly chart we are below the ema's and riding the 5 ema down.
Lower Bollinger Band is wide open and pointing down, price has made its way out of the band and is gapped from the 5 ema. Price recently touched on the 50.0 fib level of the recent swing up so a reaction is expected and this may help price make its way back inside the bands and up to the 5 ema where it will pick up fresh momentum to add to further continuation to the downside.

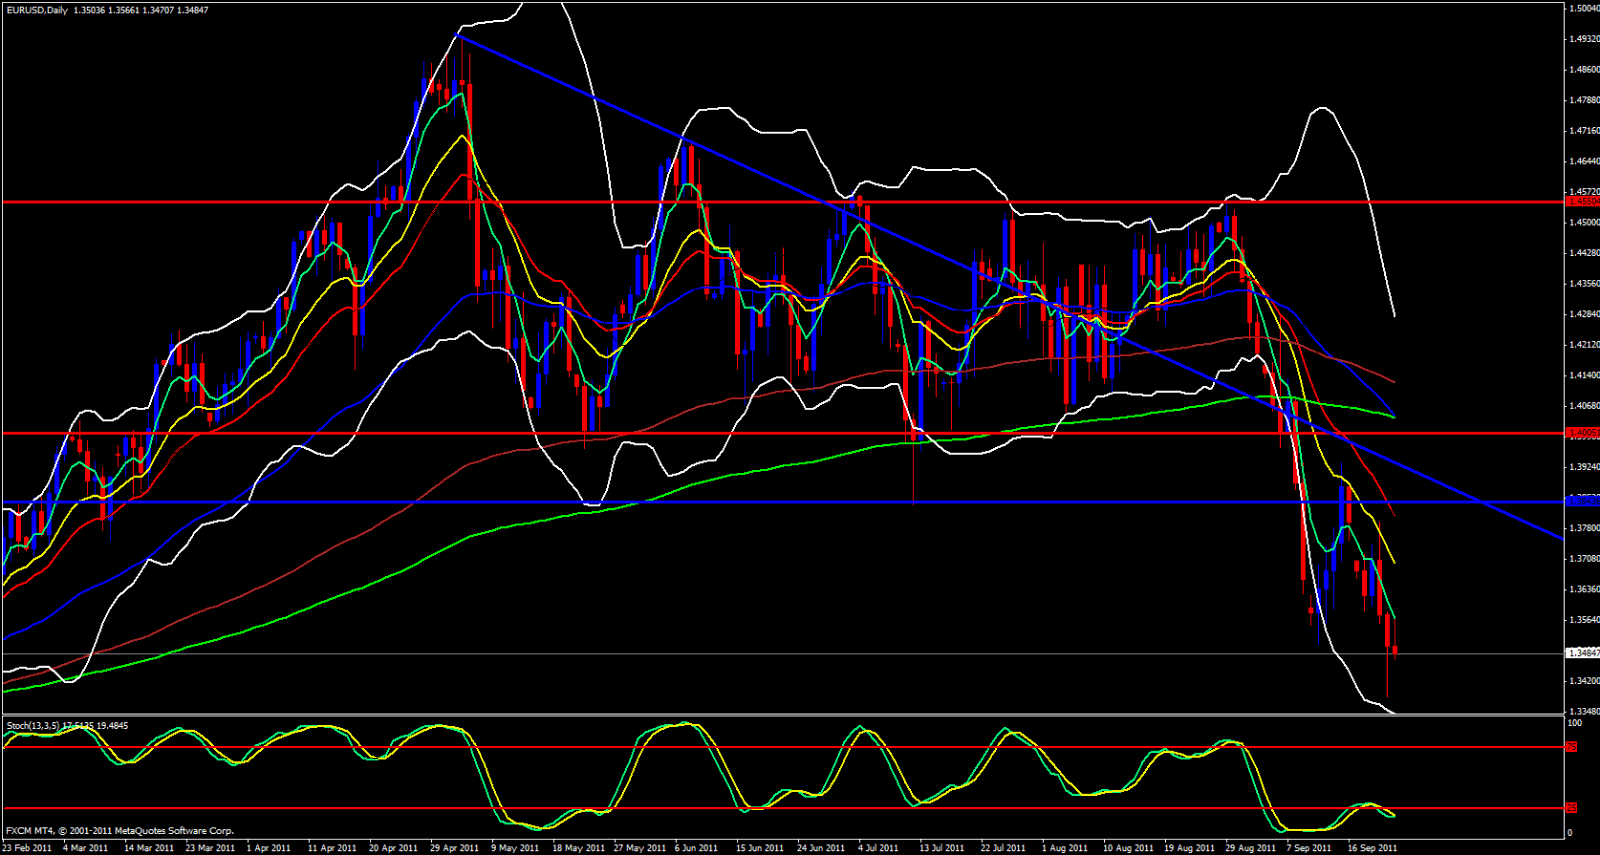
Moving over tot he daily chart price is riding the 5 ema and we can see that yesterdays candle has a long lower wick which is the result of the 50.0 fib level I just mentioned.
Today's daily candle touched the 5 ema was abruptly forced back down causing a long upper wick. Price is below the monthly S3 Pivot Point so all monthly support pivot levels have been broken and price has already broken and retested the weekly S1 and looks as though it wants to break below last week's low.

Price is just above the daily central pivot point, and heading down toward it very fast, I expect it to break through then I would look for a retest back up to it if it breaks it and this is where I would be planning a short.
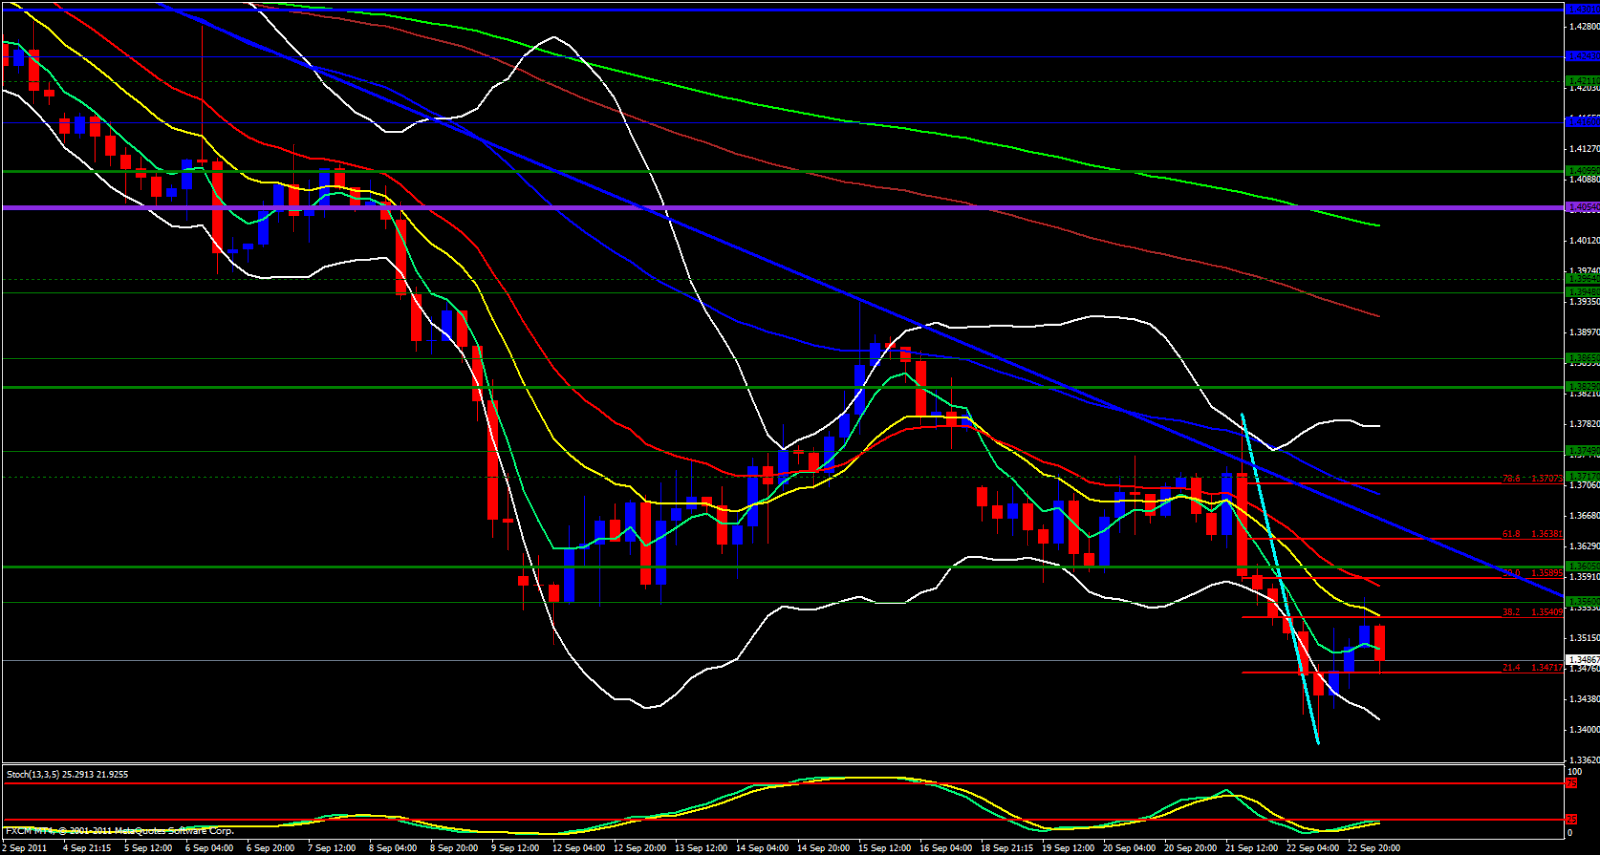
The 4 hour chart is looking predictable, price has just fibbed off the 38.2 fib level of the recent swing down and has bounced off the 4 hour 13 ema and on the hourly chart the 55 ema is at the same level as the 4 hour 13 so this adds to strong pressure to the downside.

Looking at the 15 minute chart the 5 ema has crossed below the 13 ema. Lower Bollinger Band is wide open and pointing down, price has permission to fall. USD/CHF has been very strong helping our EUR/USD fall. Bearish day ahead, beware, end of the week profit taking causes erratic price action.
