By: Doug Rosen
I start out my analysis looking at the EUR/CHF. The EUR has shown great strength compared to the CHF for the last several weeks but is now approaching visual resistance as well as a 55 ema on its weekly chart and a 233 ema on its daily chart.

It is also approaching a monthly R1 pivot point. Areas of resistance will put pressure on this pair, therefore affecting the strength of the EUR that could affect the EUR/GBP pair.
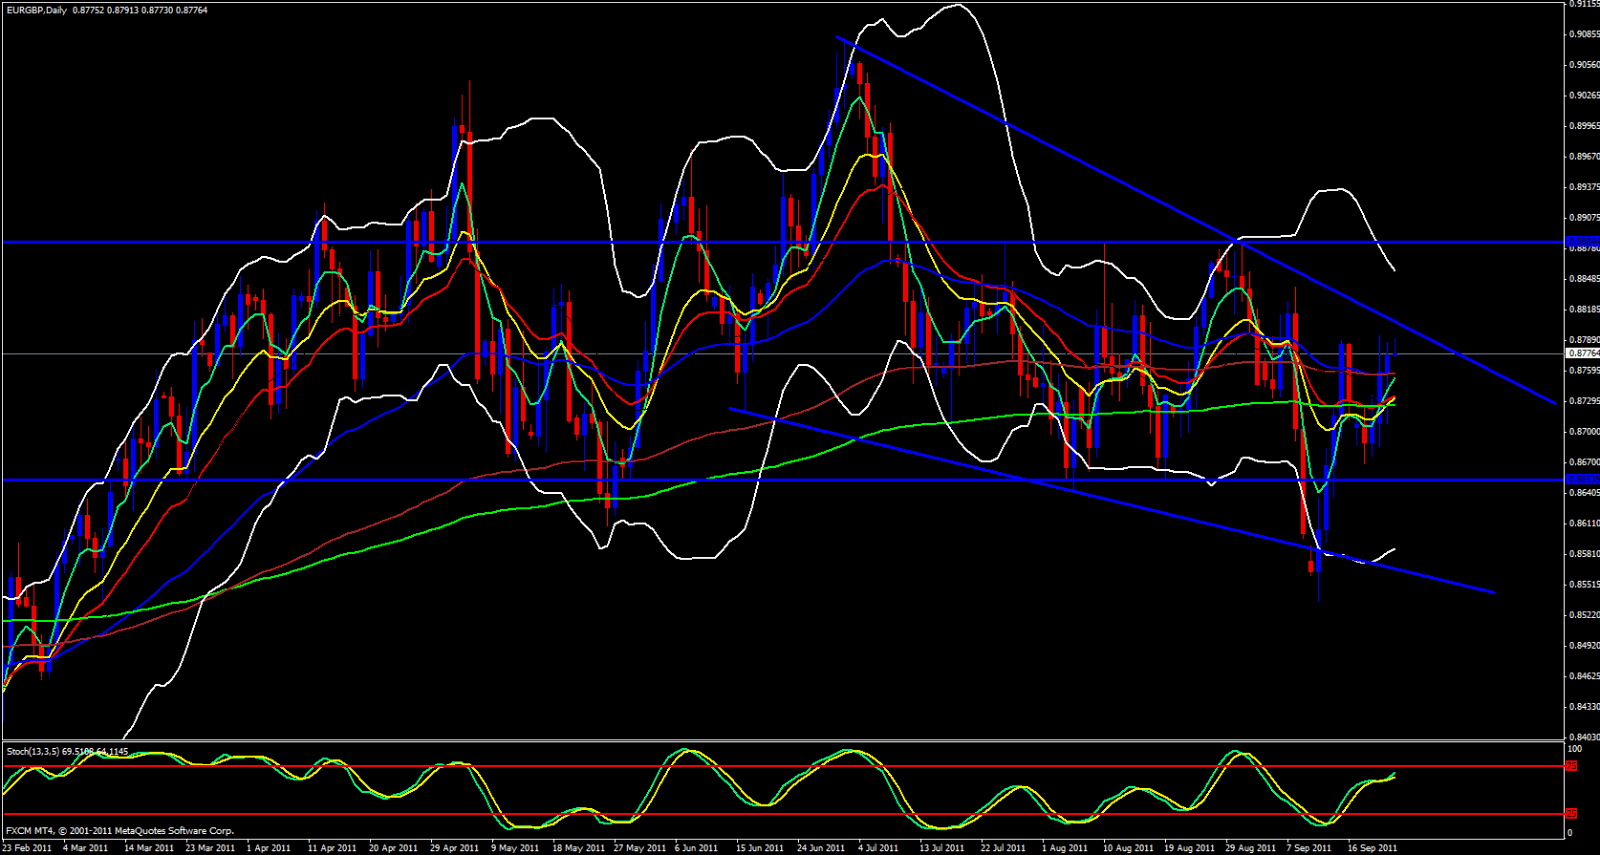
Now we look at the EUR/GBP this pair has boon looking very bullish, yet I do see it is approaching a descending trend line that may cause a pullback and/or hesitation. There are bullish signs developing on the daily chart such as ema crossovers but until we break the descending trend line we are approaching I would be hesitant to enter any longs until the line is really broken.

We are currently approaching the monthly central pivot point at 0.8790 and this area has been a tough nut to crack all month.
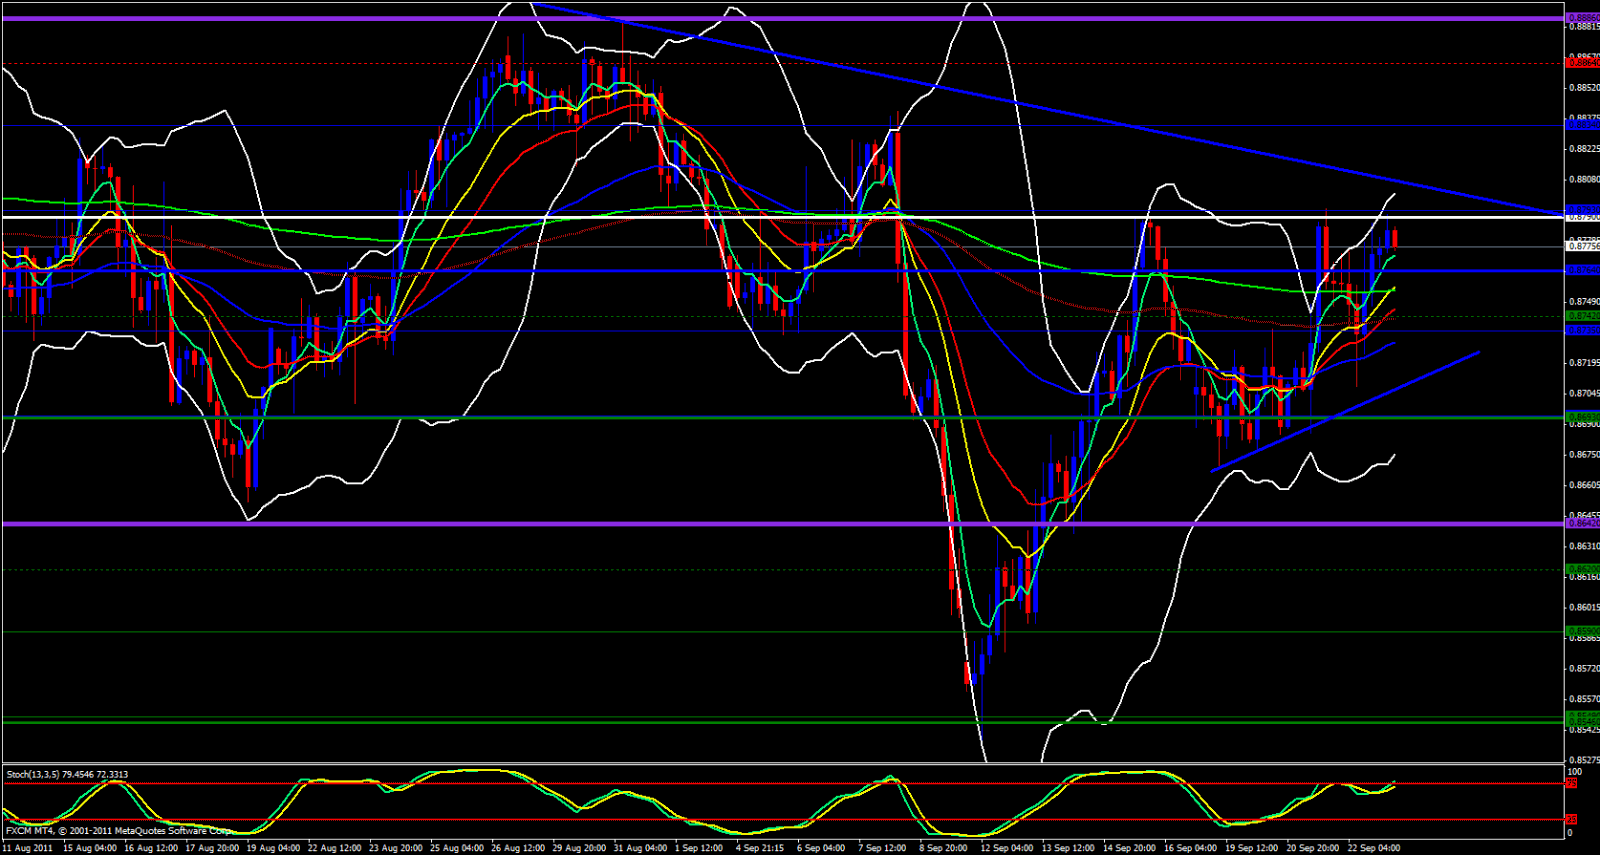
Last week's high happens to be at 0.8789 which just happens to add to the resistance that the monthly central pivot is imposing. 0.8787 just happens to be yesterdays high as well.

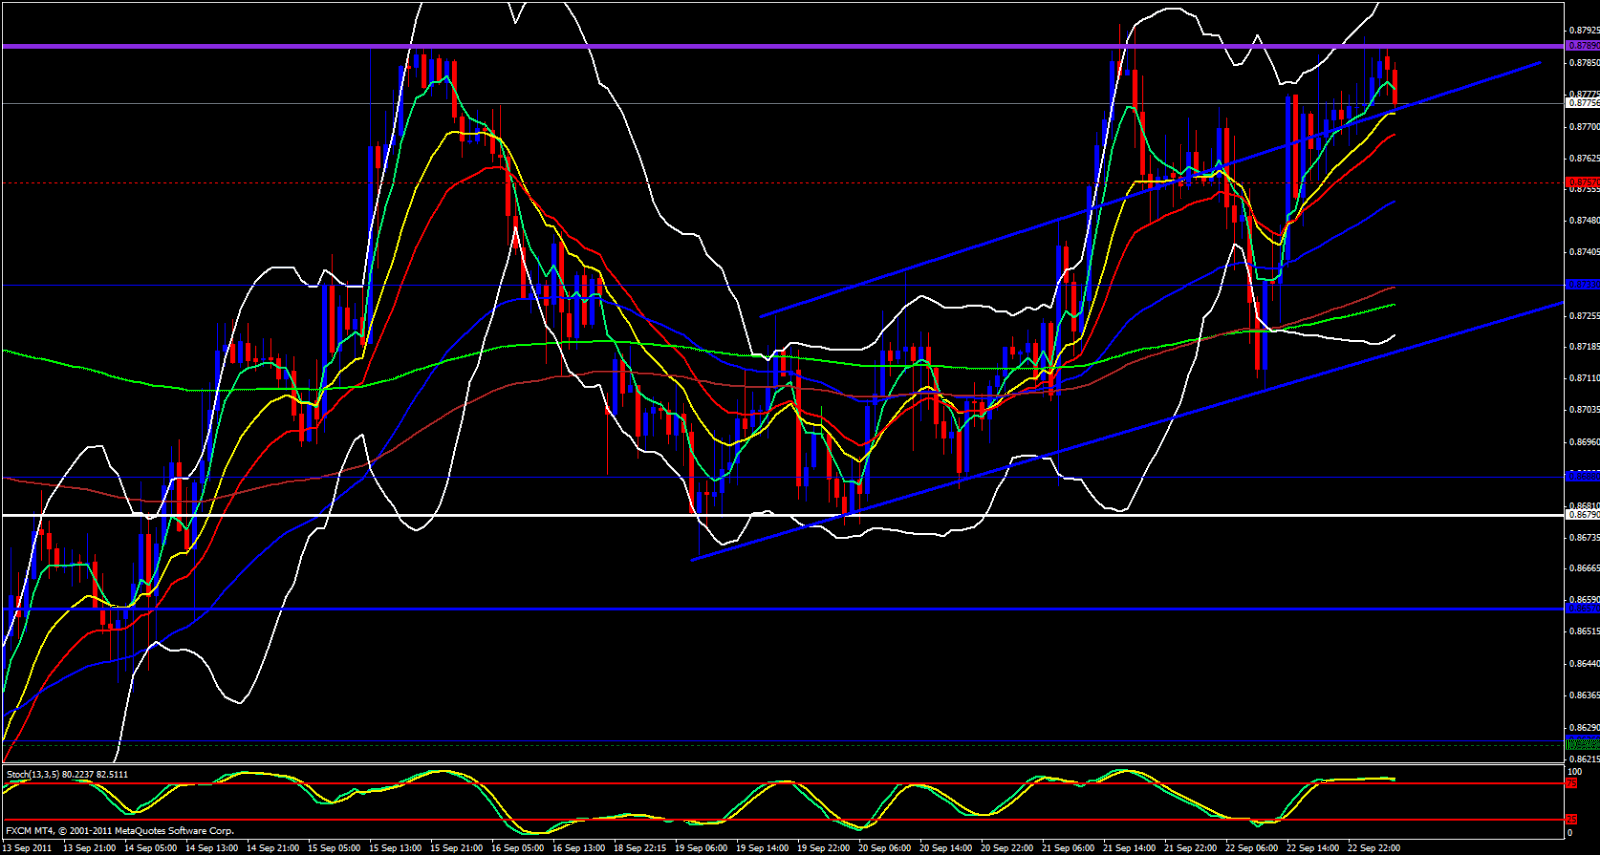
Looking at the 4 hour chart price has been riding the 5 ema up gracefully as well as on the hourly and on the 15 minute price has been riding the 21 which is still bullish but a sign price could be rolling over.
This pair looks like it can switch to bearish soon so short opportunities may soon present themselves and for those that trade the EUR/USD and the GBP/USD a bearish EUR/GBP means EUR weakness and GBP strength. These are clues that will help to make sound decisions for those said pairs.
