By: Doug Rosen
Looking at this pair today the longer term charts such as the weekly do not tell me much so I will spend most of my time analyzing this pair on the shorter time frames.
On the weekly chart this candle is currently a doji and the ema's are rather close to each other, a sign nothing is really moving.
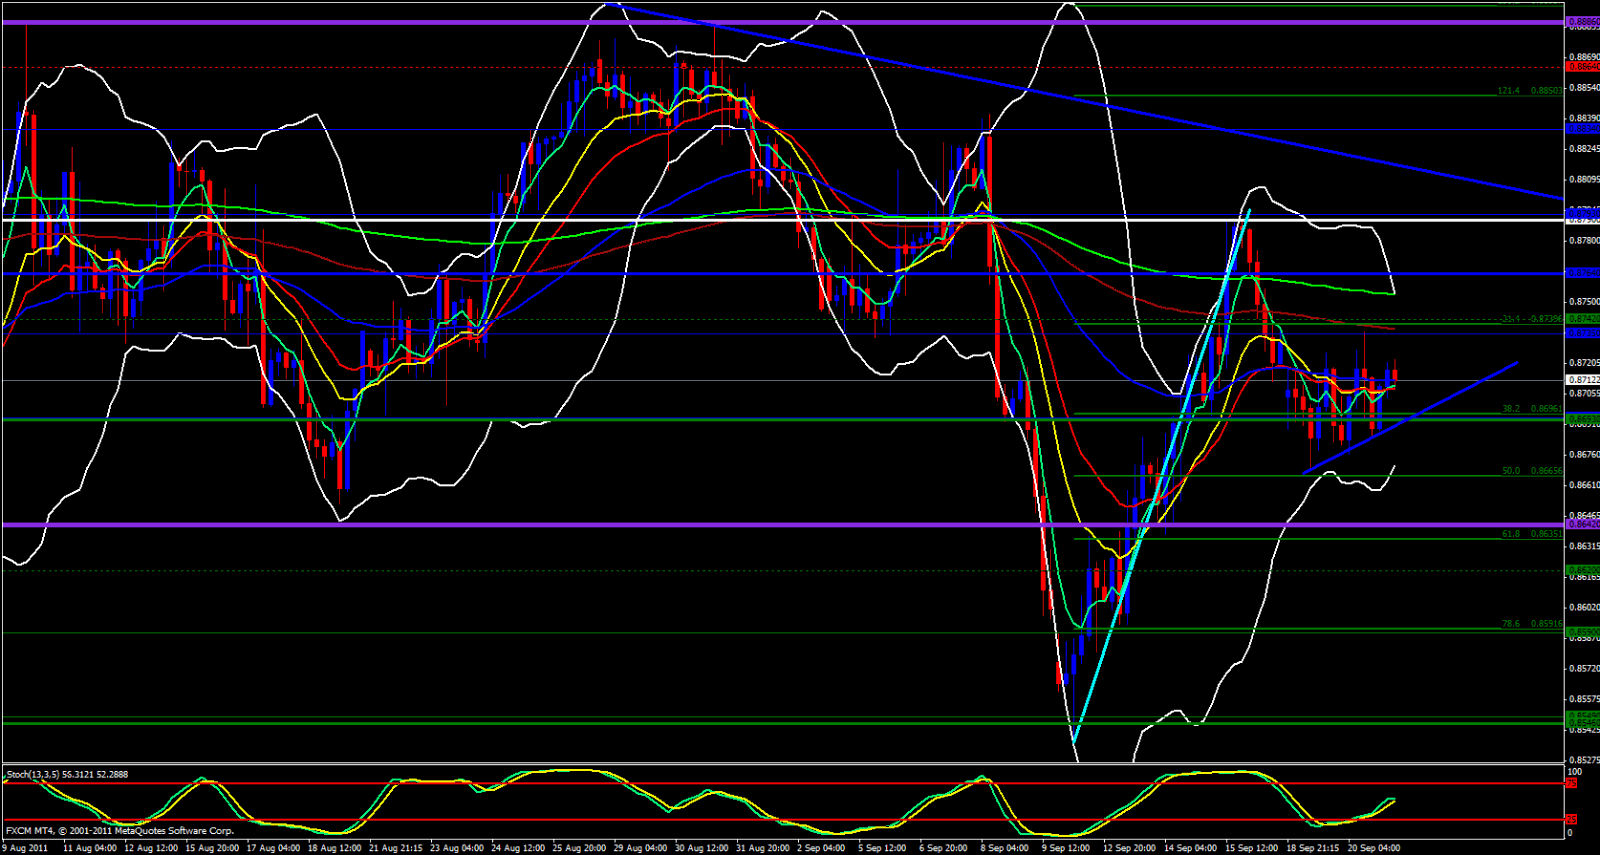
On the daily we have reached a fib but the ema's are bunched together.

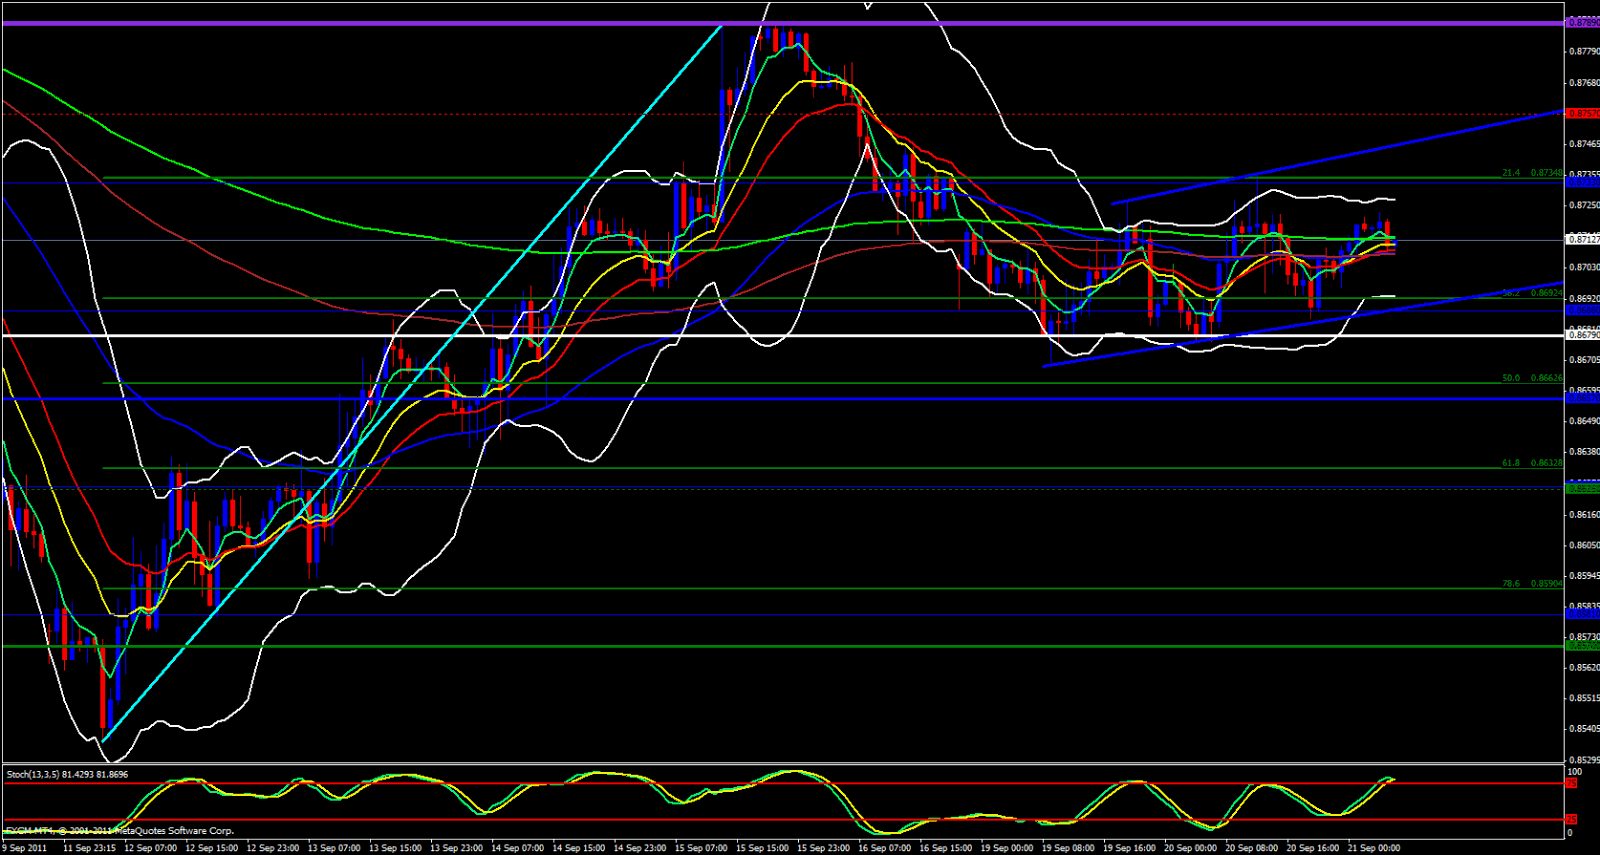
Looking at the 4 hour chart it price seems to be getting a lift off the ema's and the 5 seems to be crossing above the 13 and 21.

Moving over to the 1 hour price also seems to be getting a lift off the ema's.

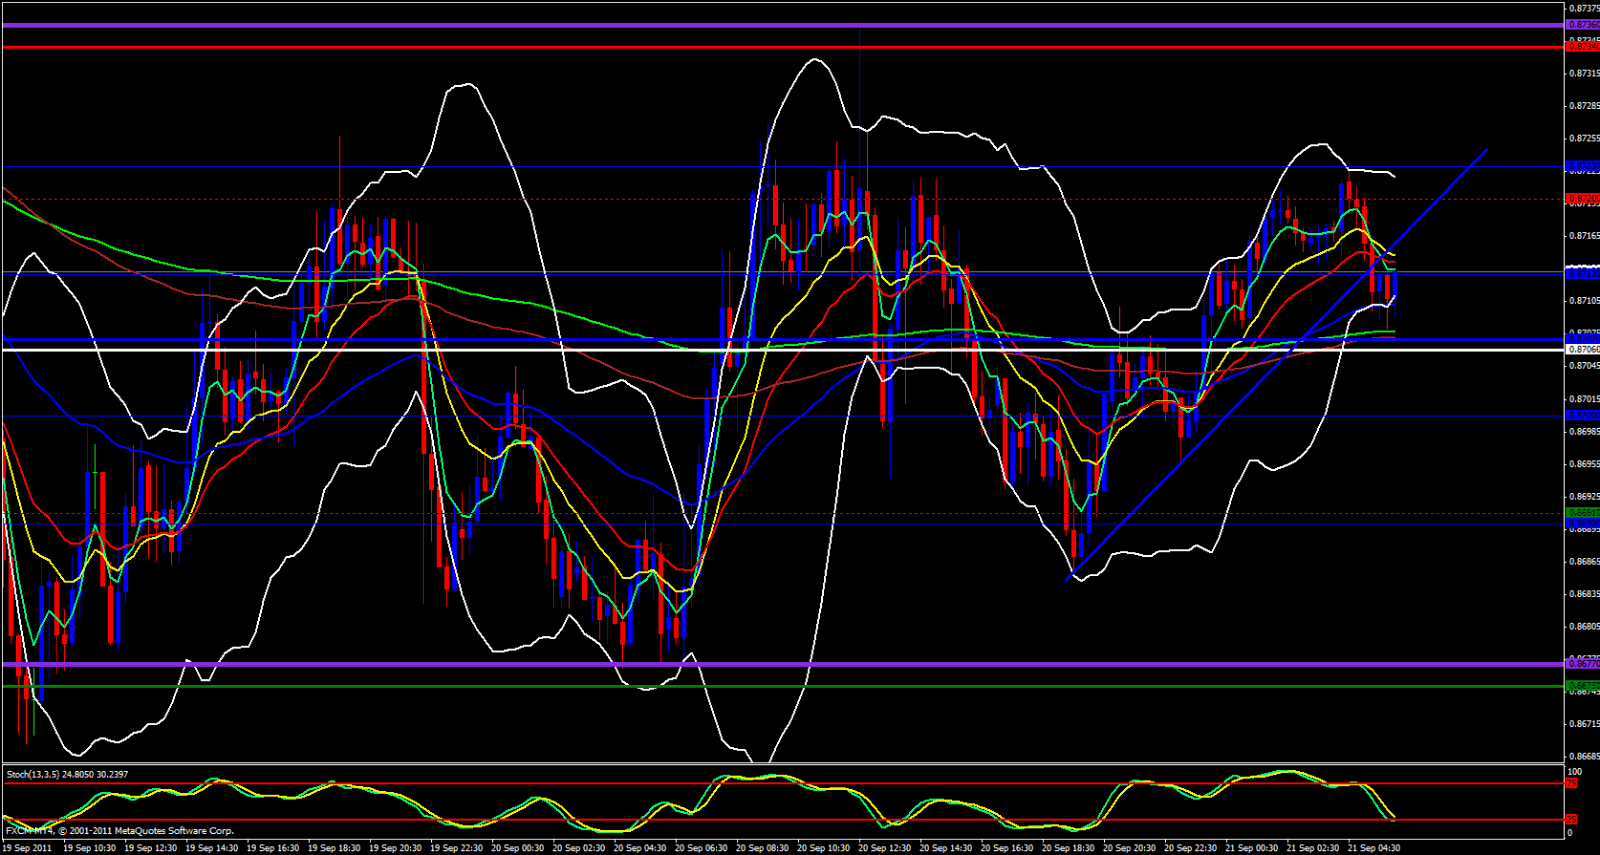
Looking at the 15 minute it appears we have broken an ascending trend line. This can be a bearish sign for this pair, however, it is meeting up with the 233 and 144 ema's which are also overlapped with the daily central pivot point and the stochastics is approaching the oversold zone. A fib back to the trendline which overlaps with the ema's crossing the trend line could be a very good opportunity to short this pair. If price reaches makes it back tot he ttrend line then tanks it could also be a good indication that the GBP/USD will take off.

