By: Doug Rosen
Today we find ourselves with a bearish EUR/GBP. On the weekly chart the 13 is crossing below the 21 ema and the 5 is prepping to cross below the 55 ema. Lower Bollinger Band is open and pointing downward.
.gif)
Moving over to the Daily we see that the 21 is coossing the 233 ema and the 5 ema is trying to connect with price. Stochastics is in the trade zone looking as though it wants to cross downward.

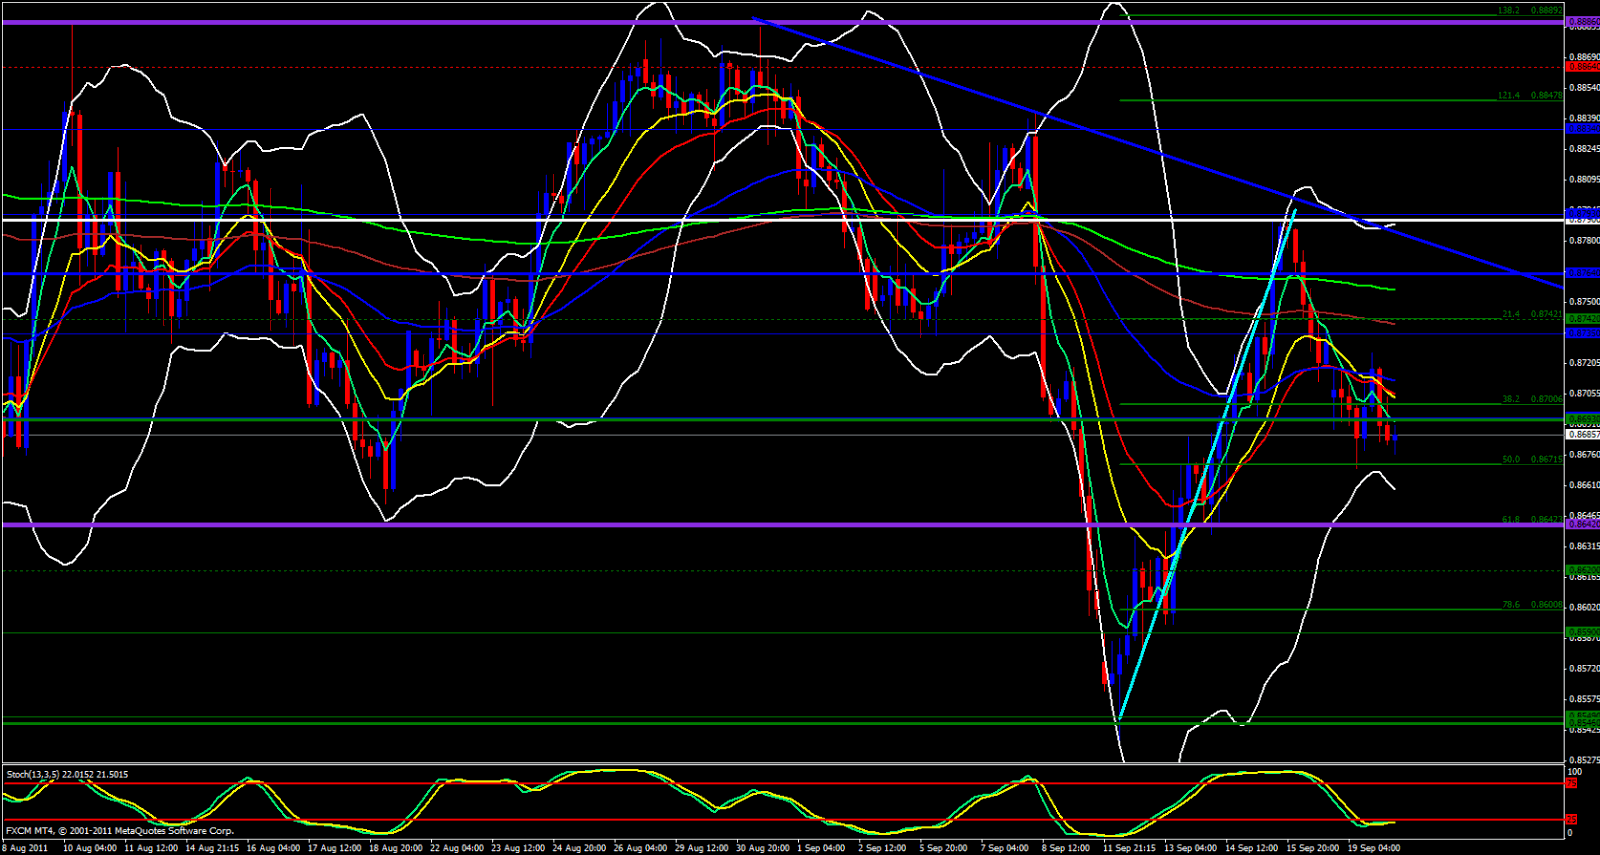
Moving over to the 4 Hour chart the 5 ema has crossed below the others and price is beginning to ride with the 5. Lower Bollinger Band is sharply pointing downward. We have also busted the monthly S1 Pivot but we must be careful because we are in the midst of a bullish fib zone. In fact, the 50.0 fib is at 0.8672 and a reaction at that level should be expected. This type of reaction will offer a short opportunity as well. Probably watch for a reverse fib at around 0.8700 - 0.8710 area if that reaction occurs. It is also worth noting that the weekly central pivot is at 0.8679 which adds to the fib. Based on the angle and seperation of the ema's I would expect this level to break.

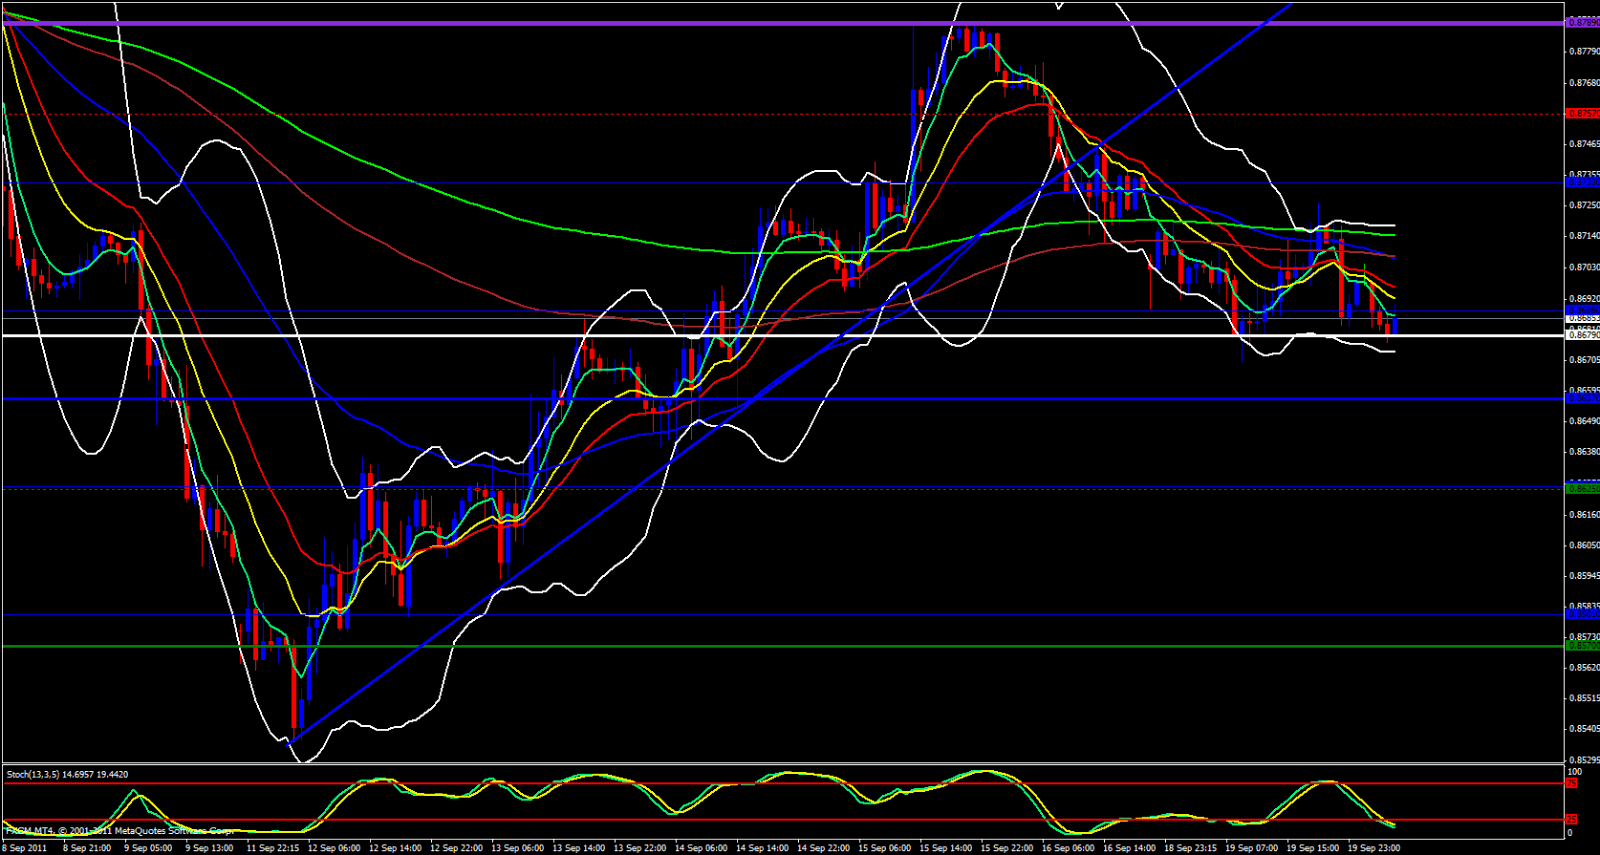
Moving over to the 15 Minute chart we continue to look bearish on this pair and at this moment we are fibbing just at the daily M2 with the 15 minute 55 ema not far above. I also want to note that the lower Bollinger Band is pointing down.
