By: Doug Rosen
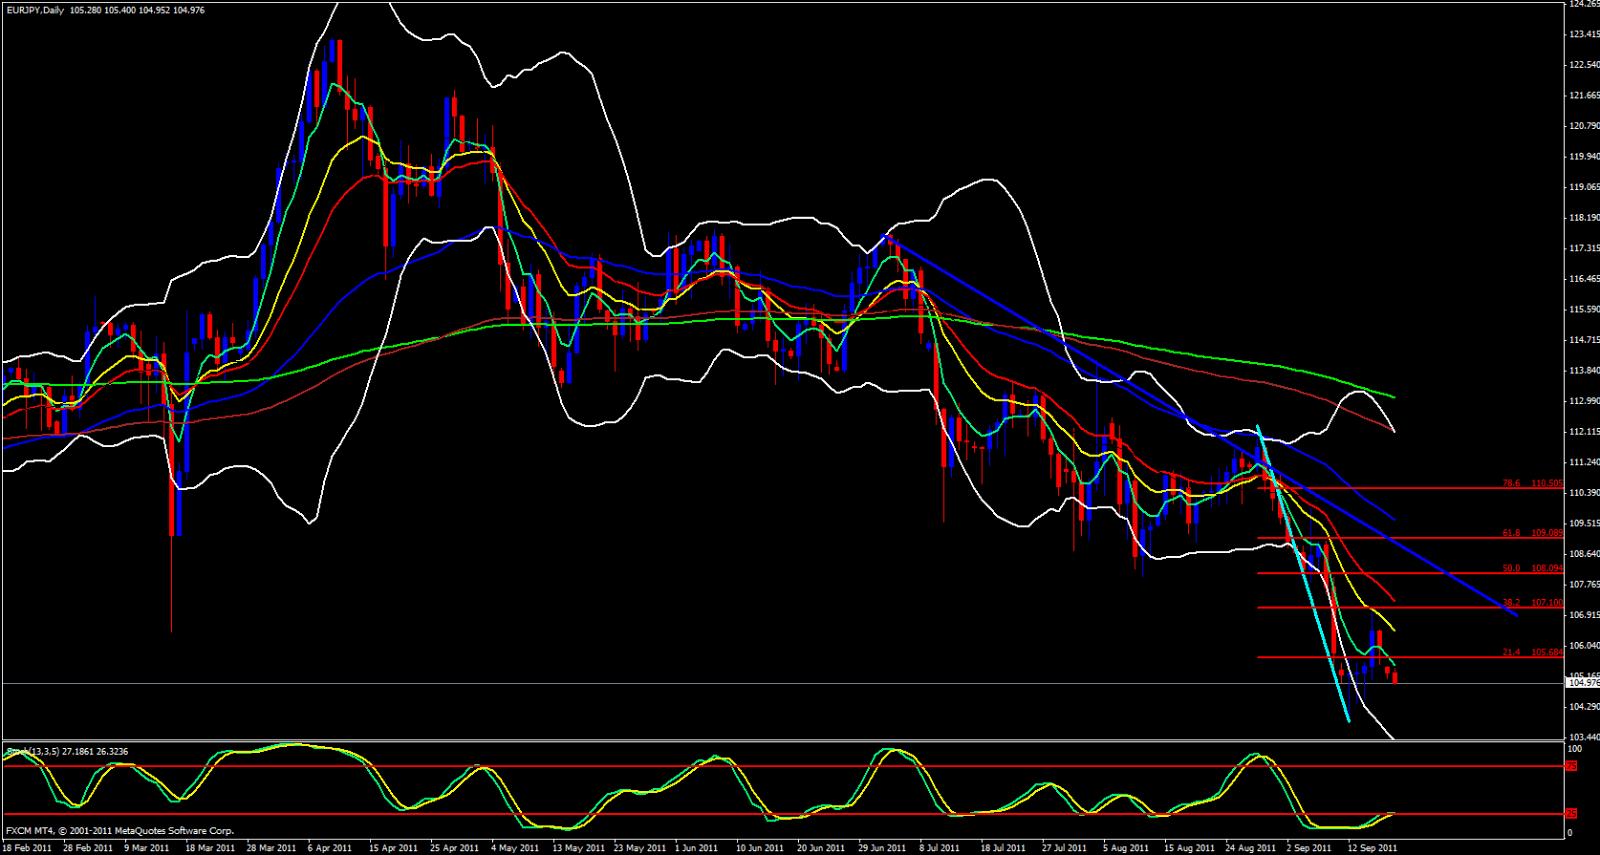
This pair continues to look extremely bearish. On the weekly chart it is coasting down the 5 ema with the 13 ema stepping in each time the 5 is breached. Looking at the daily chart it is very obviousy that price has retraced to the 38.2 Fib which overlaps with the 13 ema making that 38.2 fib very strong resistance. The ema's on both the weekly and daily charts have substantial angle and seperation between each of them which indicated a fast and powerful down trend.

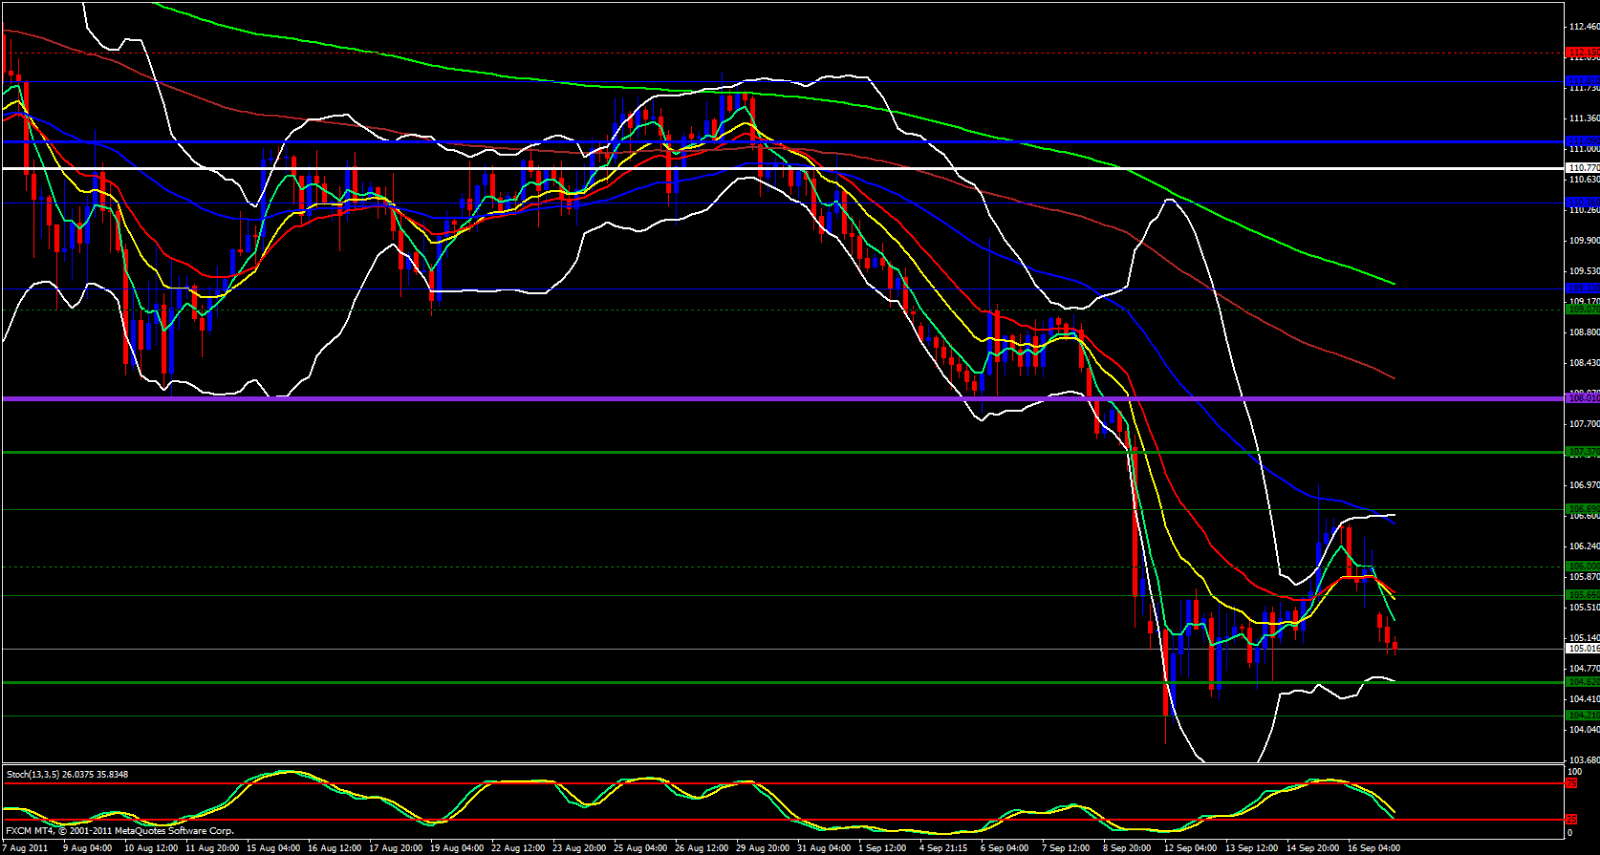
Moving over to the 4 Hour chart I see that the 5 ema has crossed below the 21 and 13 ema's with the Stochastics falling down. The monthly S2 is at 104.62 so I expect a bit of a fight at that level.

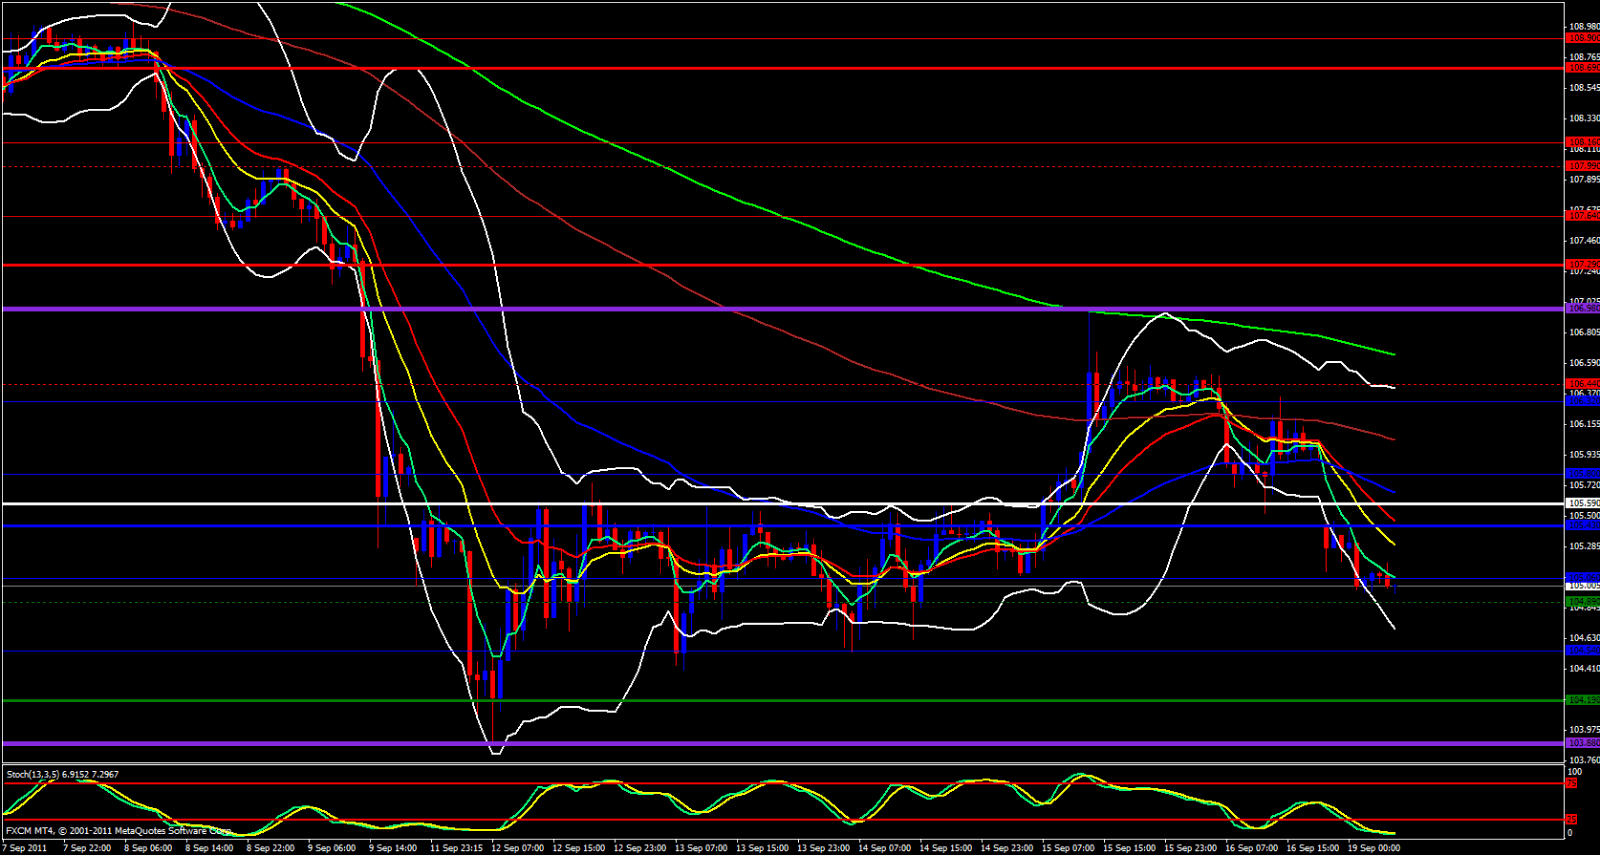
Moving over to the hourly chart I see that price is also gliding down the 5 ema wit the 13 not to far above it to step in if it has to. The lower Bollinger band is wide open and pointing downward giving price full permission to continue tanking.

Moving down to the 15 minute chart price just recently came into contact with the 21 ema overlapped with the upper Bollinger Band pointing down adding force to the downtrend. The 15 minute Stochastics is pointing down and price looks very heavy but I cannot ignore that the 15 minute Bollinger Bands are beginning to narrow and price is just above the daily S2 (my daily pivot points tonight are based on Fridays price action). I expect price to continue to drop today to around 104.20 which is the weekly S1 and can go as far down as 103.88 which was the Friday low.
See how this market analysis translated into profitable trades here.

