By: Doug Rosen
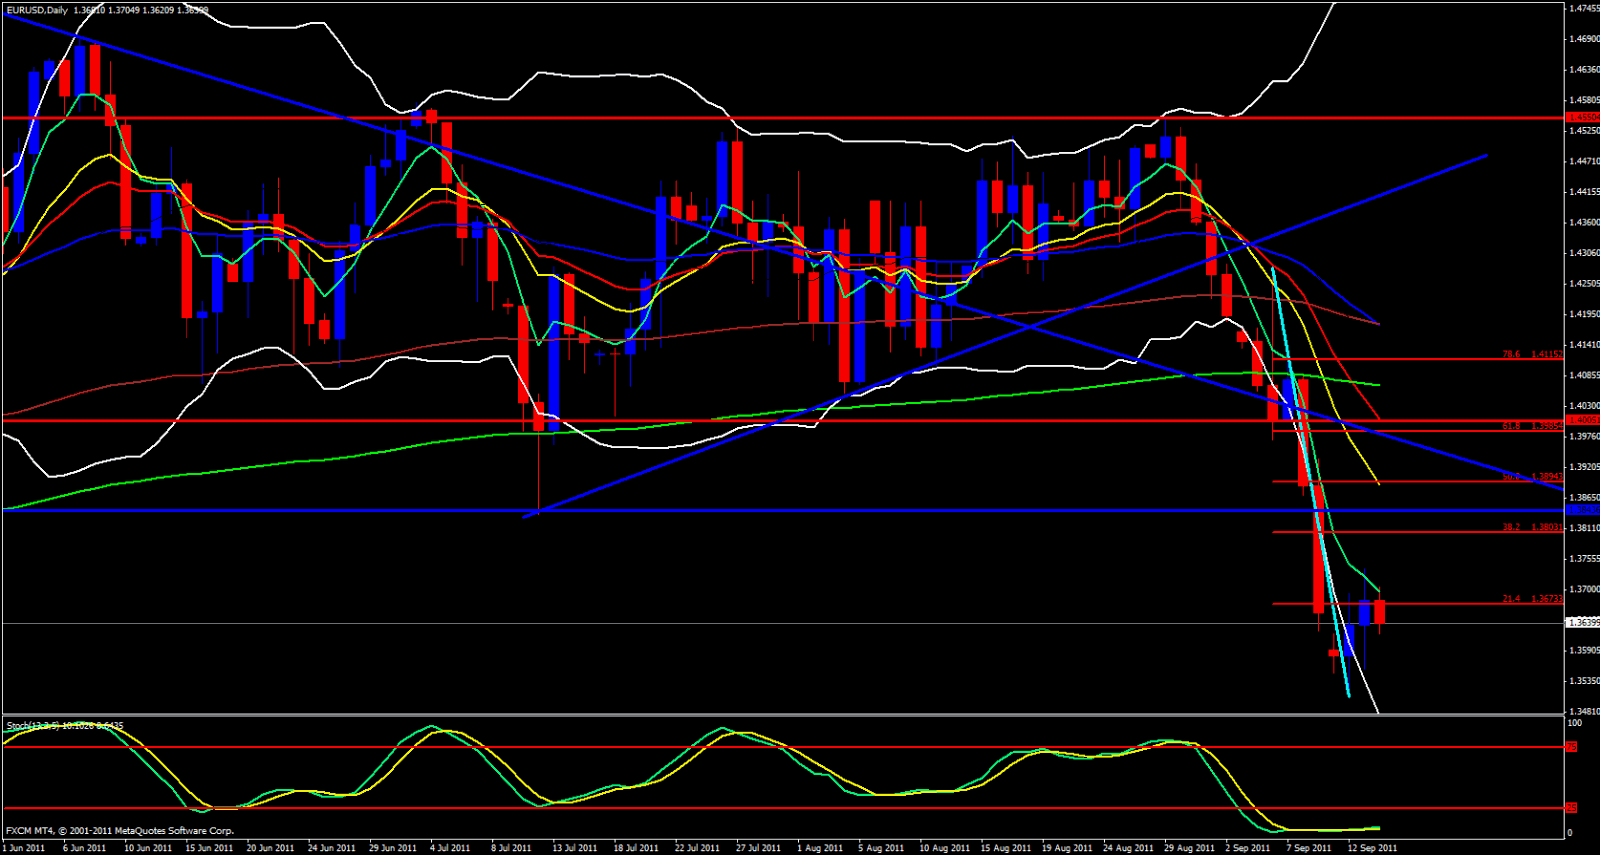
For the last couple weeks this pair has been in a very steep downtrend. It has broken a price trap I had it in, it has broken trend line. A break out such as this usually follows up with a retracement to or near the break area.
On the weekly chart we extended way outside of the lower Bollinger Band. 80% of price action takes place within the bands so price is expected to work its way back within the bands. Price also melted right through the 144 ema but was halted by the 233 ema. The 5 ema is about 170 pips above current price and price has a natural tendency to want to ride the 5 ema.

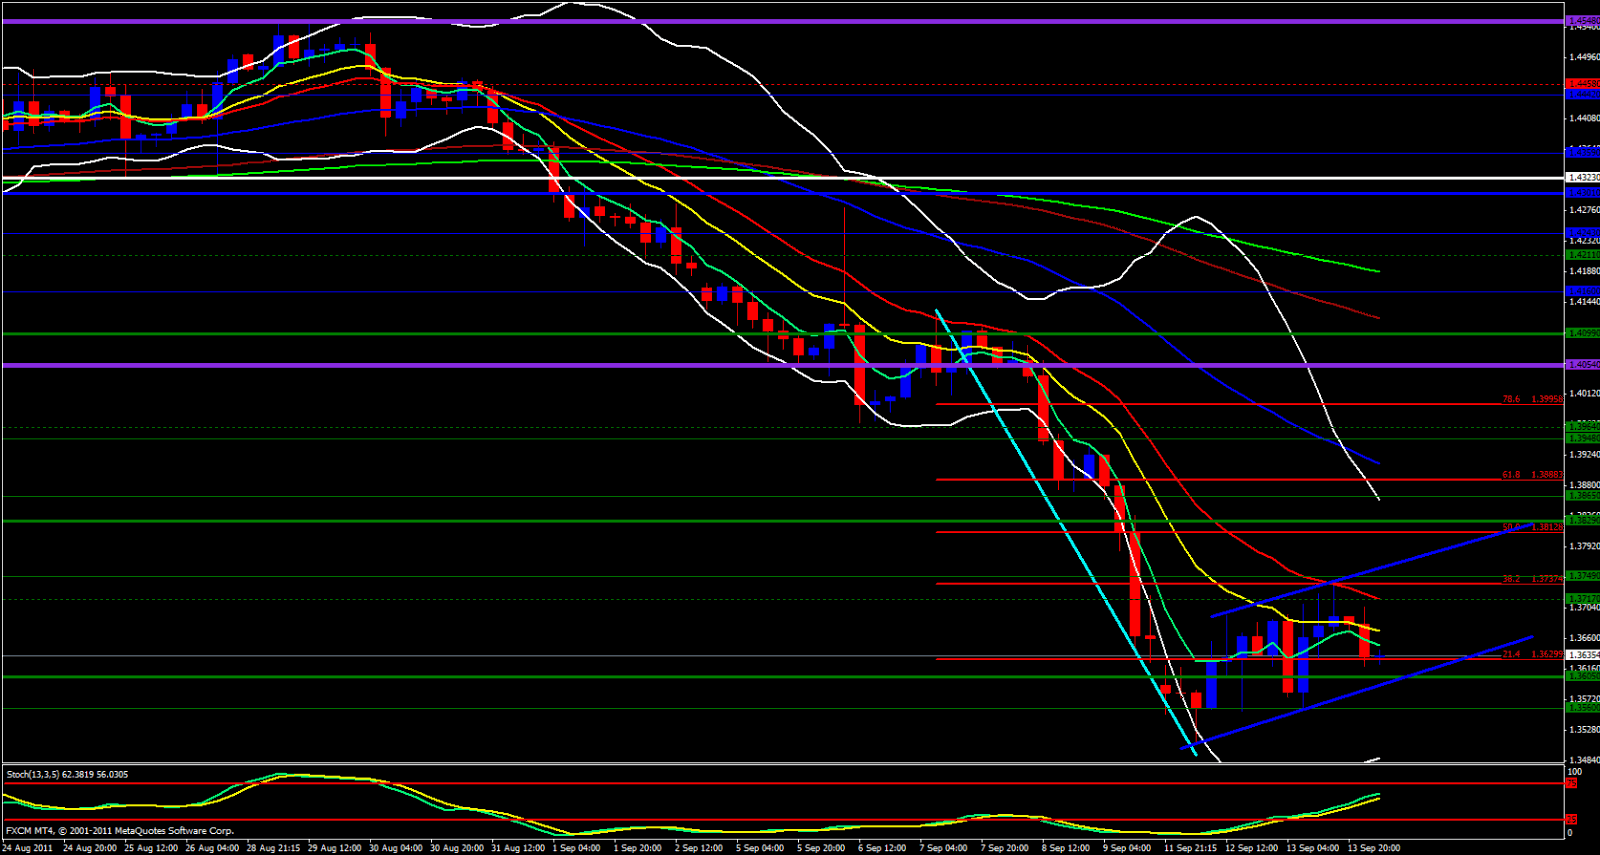
On the Daily Chart we have drifted back up to the 5 ema but we have yet to make a 38.2 Fib which is the minimum Fib retracement I would expect after such a heavy drop. The 13 ema just happens to overlap with the 50.0 Fib of the drop and I would love to see price works it's way to that zone. More than likely as price makes its retracement back up it will pull the 13 ema down a bit and they should meet up somewhere in between the 38.2 and 50.0 fib levels.

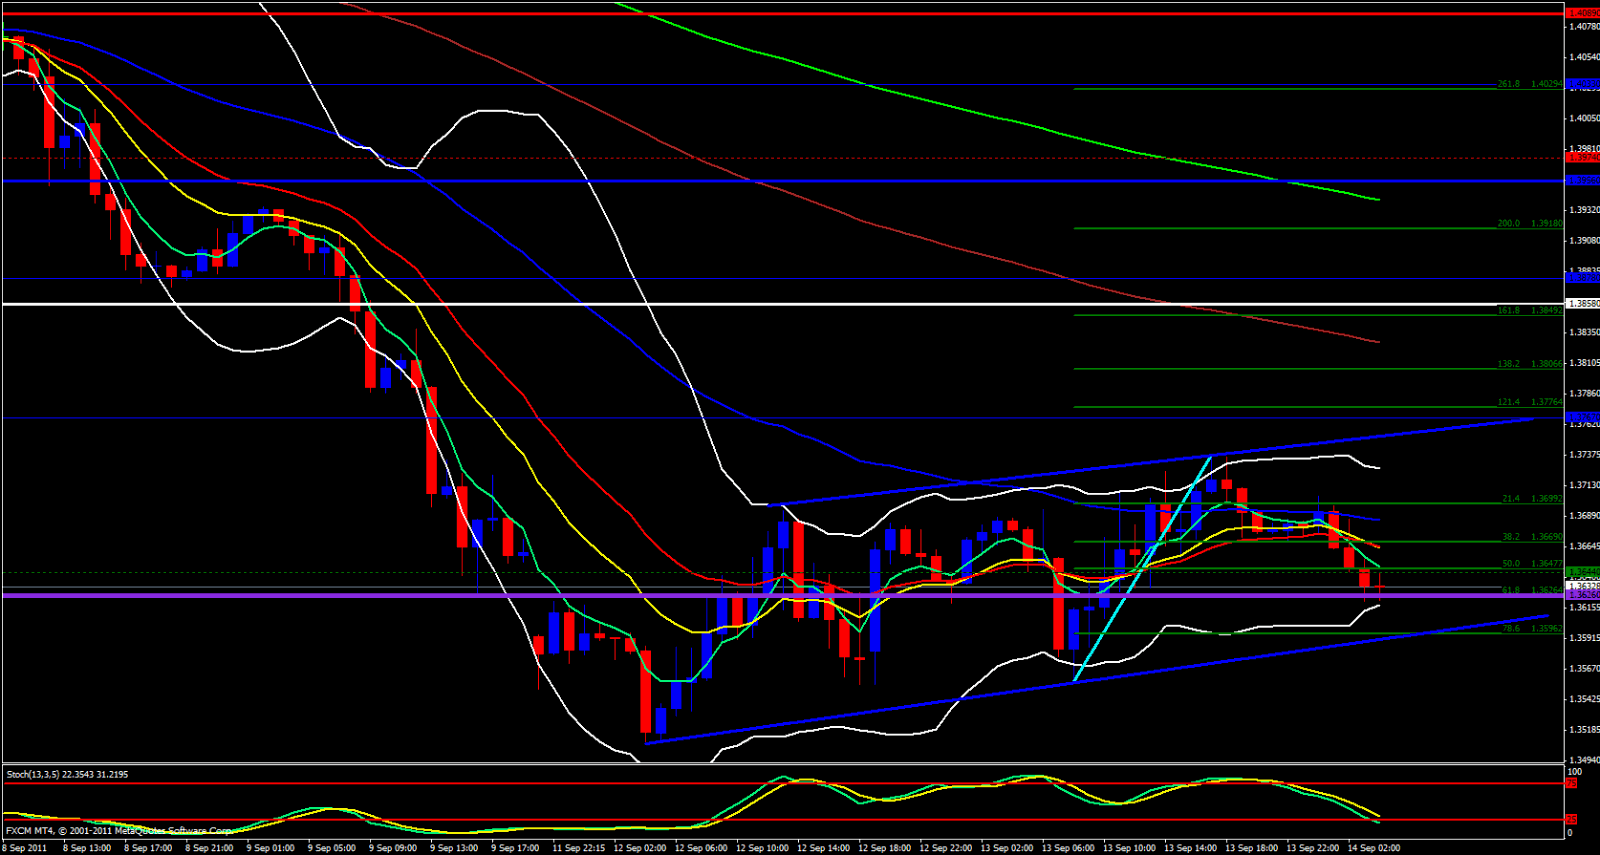
On the 4 Hour Chart which is the chart I use to plot my monthly Pivot Points it appears to me that price is in a bit of a price channel yet towards the bottom within 35 - 40 Pips. If price reaches the bottom of this channel that would put us at around 1.3605 which overlaps with the Monthly S3 On the Hourly Chart which is the chart I use for my Weekly Pivots Last week's low is around 1.3626, close enough to the 1.3605 level and the lower Bollinger Band is around the 1.3615 region so I would start watching that area for price to bounce off of if considering a long off the bottom channel and keep in mind Stochastics is in the Oversold zone. If price breaks 1.3590 look for shorts to 1.3555 area.


