By: Doug Rosen
EUR/GBP pair made a big move yesterday and starts out today with some space in between current price action and the ema's On the weekly chart we see that the 5 ema is pointing up and setting up to make a cross over the 13 and 21 ema's.

I think it is important to point out however that we are almost up against a descending trend line at the top of a price trap.
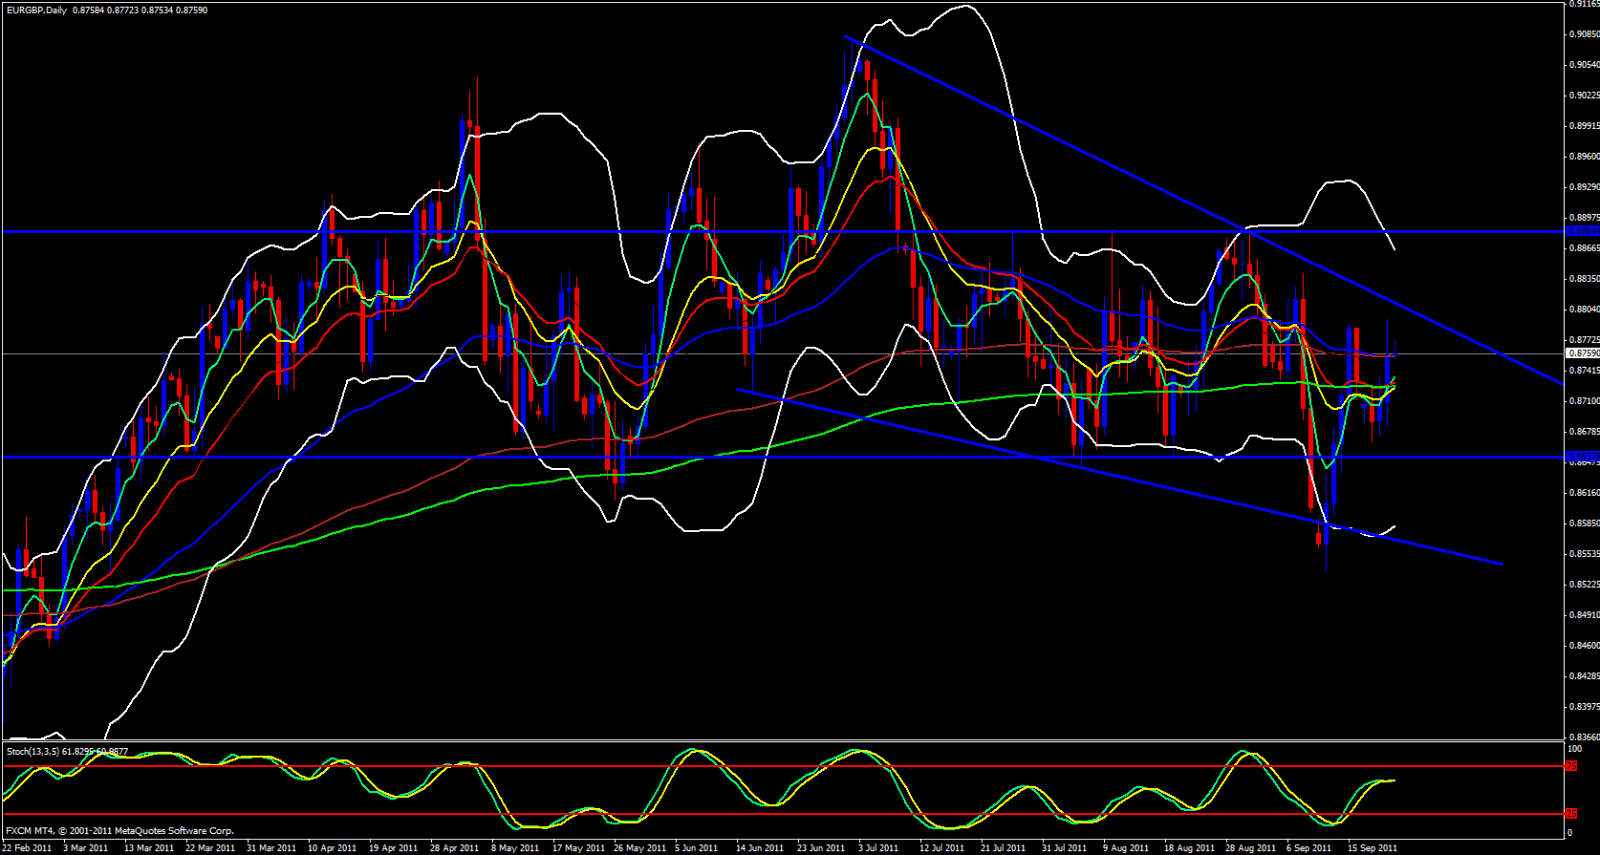
Moving over to the daily chart I see that the 5 ema is crossing through the 13, 21 and 233 ema's, however, today's daily candle begins at the 55 ema, an area where I would expect a pullback or to the ema's or some hesitation until the ema's catch up. A drop down to the ema's would be nice since it would give us a fib setting us up for continuation to the upside.

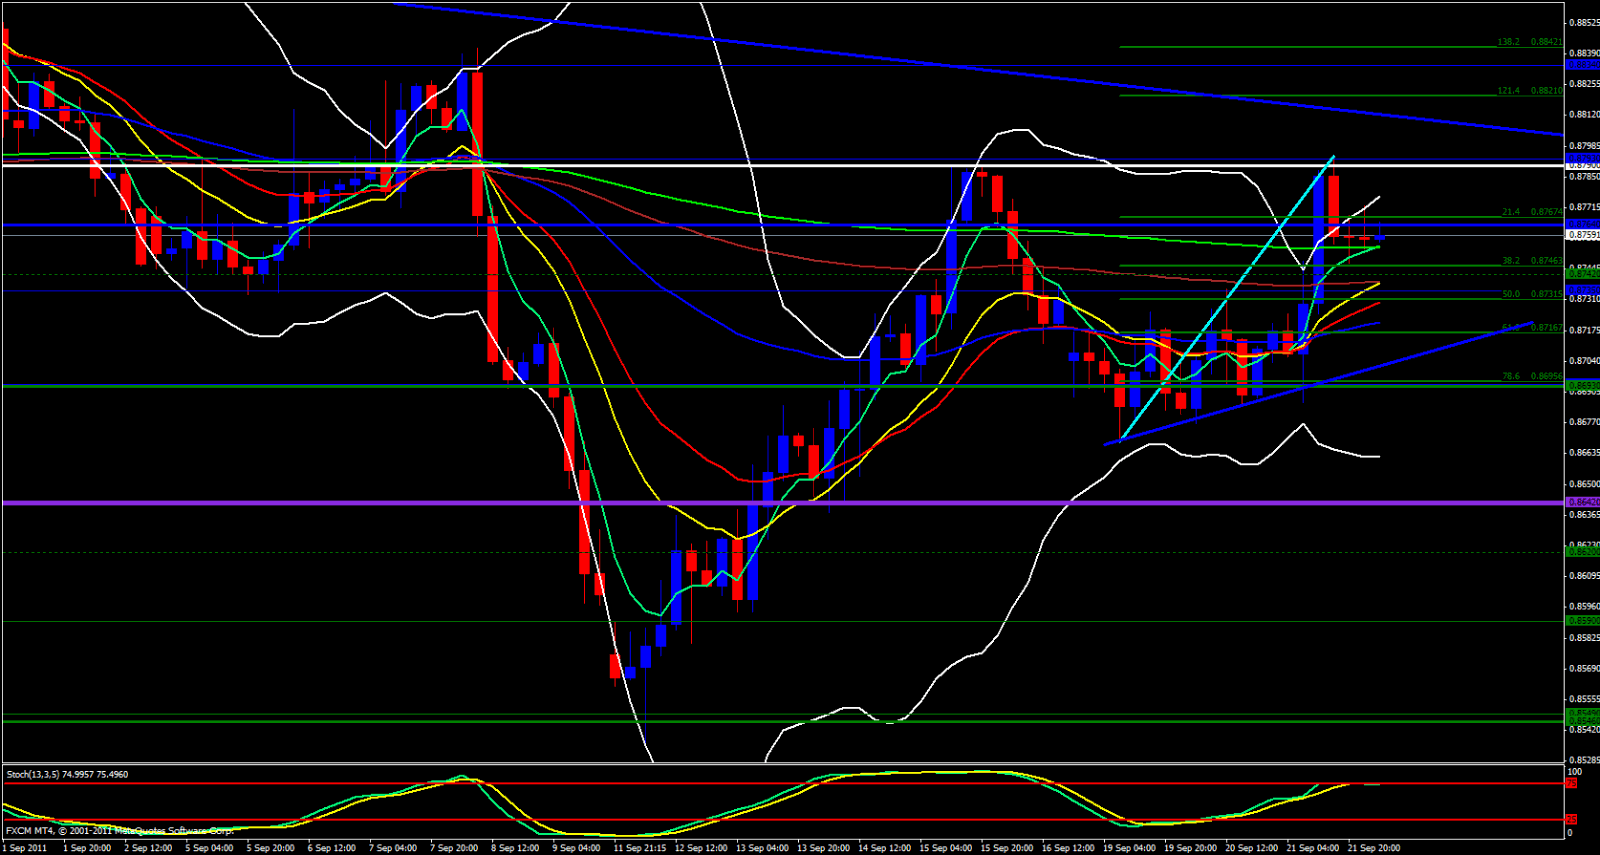
Moving over to the 4 Hour chart I see that the 5 ema is crossing above the 233 and the upper Bollinger Band is open and pointing upward and that price is riding the 5 ema. Moving over now to my 1 Hour chart I see that price has been riding the hourly 21 ema with the weekly M3 and the 38.2 fib oof the recent swing up overlapping the 21 which gives this paid a bullish feel to me. Price is above the daily central pivot point.

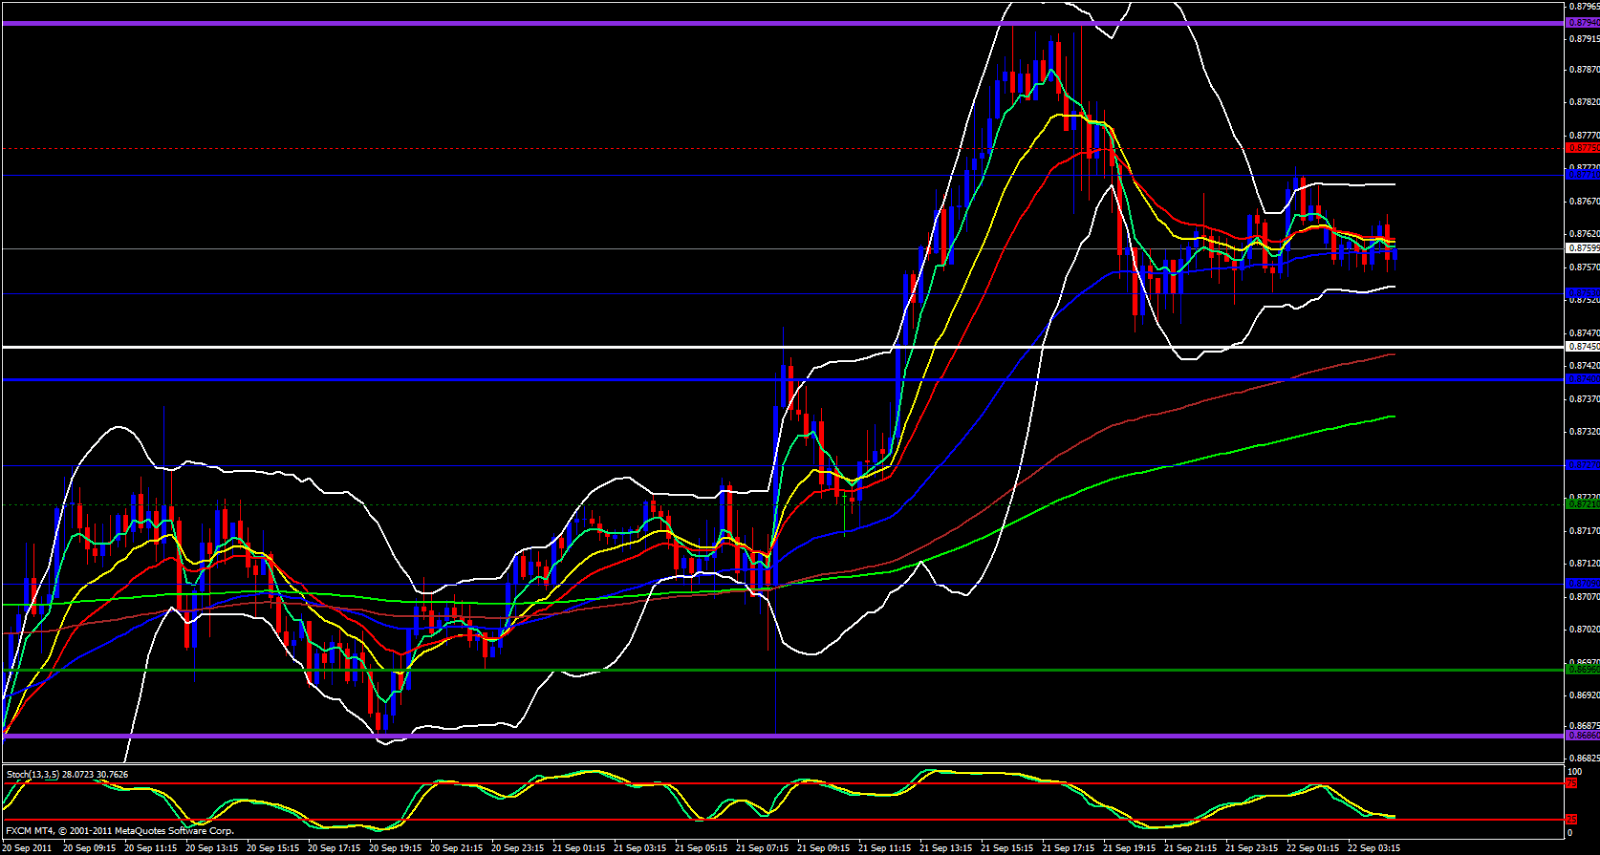
Finally I look to my 15 minute chart I see that the 5 ema is beginning to cross the 13 and 21 ema's and price looks like it wants to head up. The next area of resistance that I see is the region between 0.8771 - 0.8775 and if broken price should head up to around the 0.8790 - 0.8795 region where I expect it will make a drop.
