By: Doug Rosen
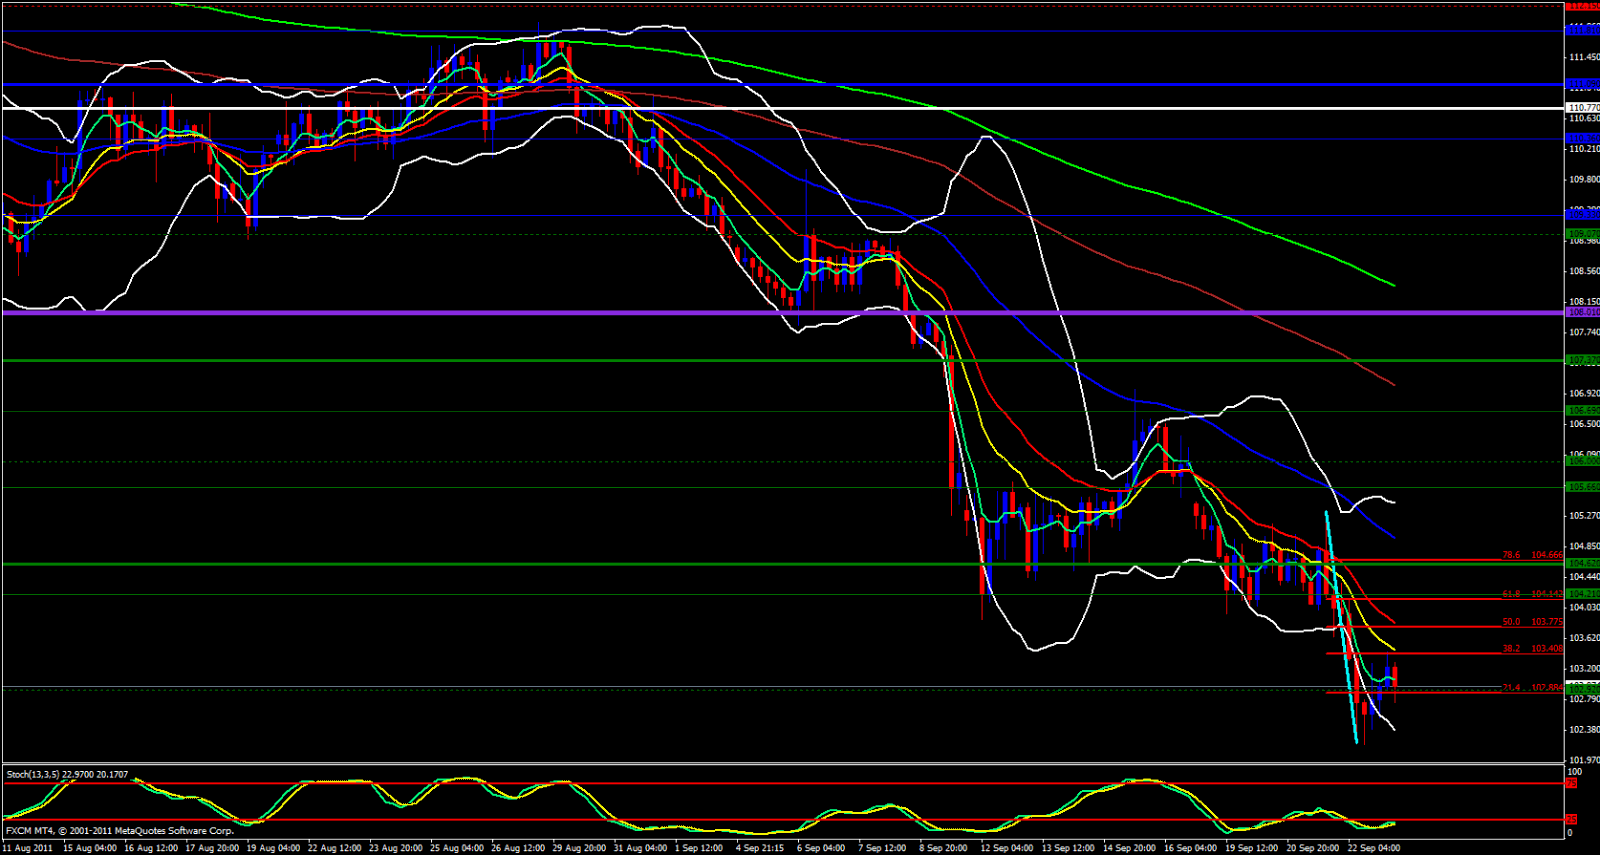
EUR/JPY pair continues to be predictable. In all my analysis I point out that price is riding the daily 5 ema which it has. On the weekly chart the stochastic is in the oversold zone, price is outside of the lower Bollinger Band and gapped from the 5 ema.

On the daily chart price is within the bands but the lower band is open pointing down but the stochastic is also in the oversold zone and a bit away from the 5 ema so I believe price as always, needs to give the 5 ema a chance to catch up so further bearish price action continues downward.

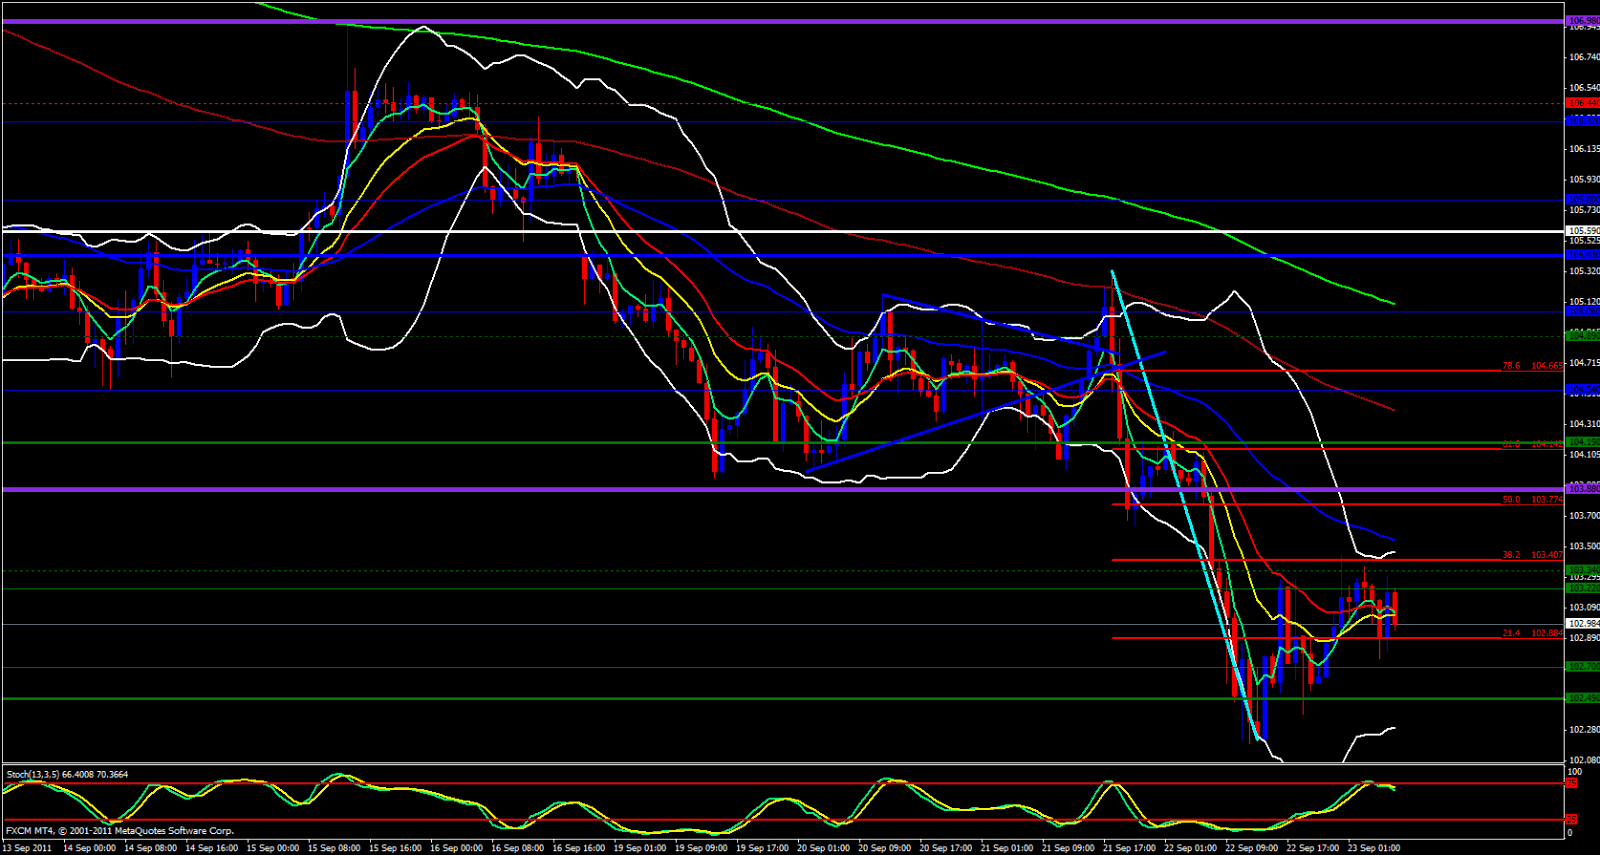
Price is rising above the monthly M0 Pivot Point and is approaching the weekly M1 and is bouncing up above the daily central pivot point. Taking a look at the 4 Hour chart I see that price is making a fib of its recent 4 hour swing down. It is already approaching the 38.2 Fib level which is overlapped with the 13 ema but could go to the 50.0 Fib level which also overlaps with the 21 ema.
These are areas to watch for since they can offer short opportunities. On the hourly chart the 38.2 Fib I just mentioned also overlaps with the hourly 55 ema and weekly M1. The 50.0 Fib Level overlaps with last weeks low as well as overlaps with the daily R1.

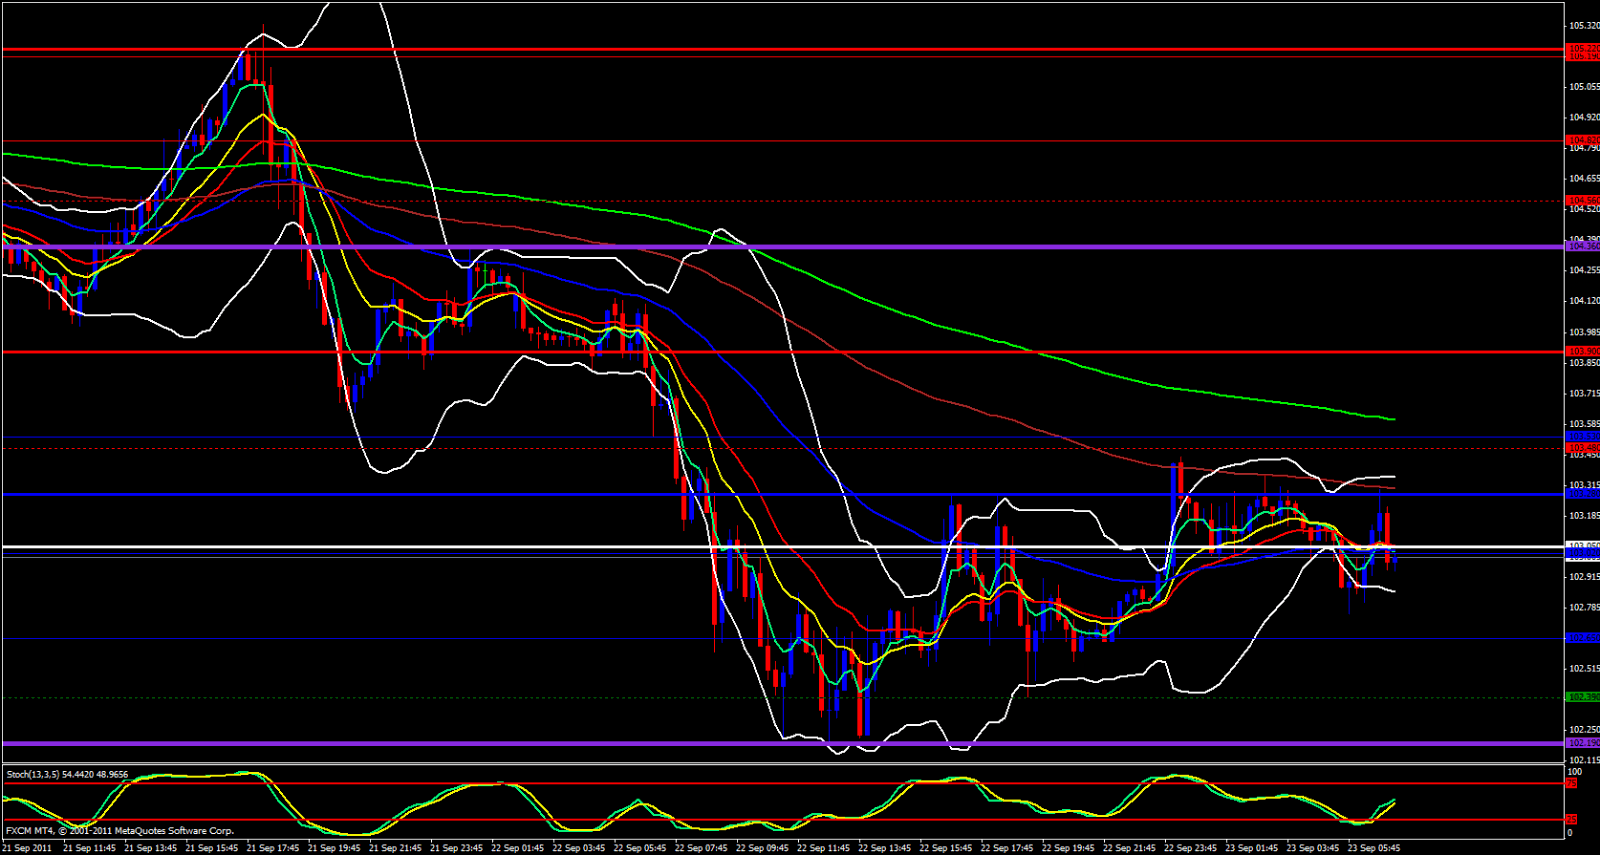
On the 15 minute chart price seems to be heading up a bit but the Bollingers are narrow and the stochastic is bullish. I expect price to climb up just a bit and i would expect bearish continuation around the 103.70 - 103.90 levels. As always, it is the end of a bearish week and end of the week profit taking could force price up further than we anticipate.
