By: Doug Rosen
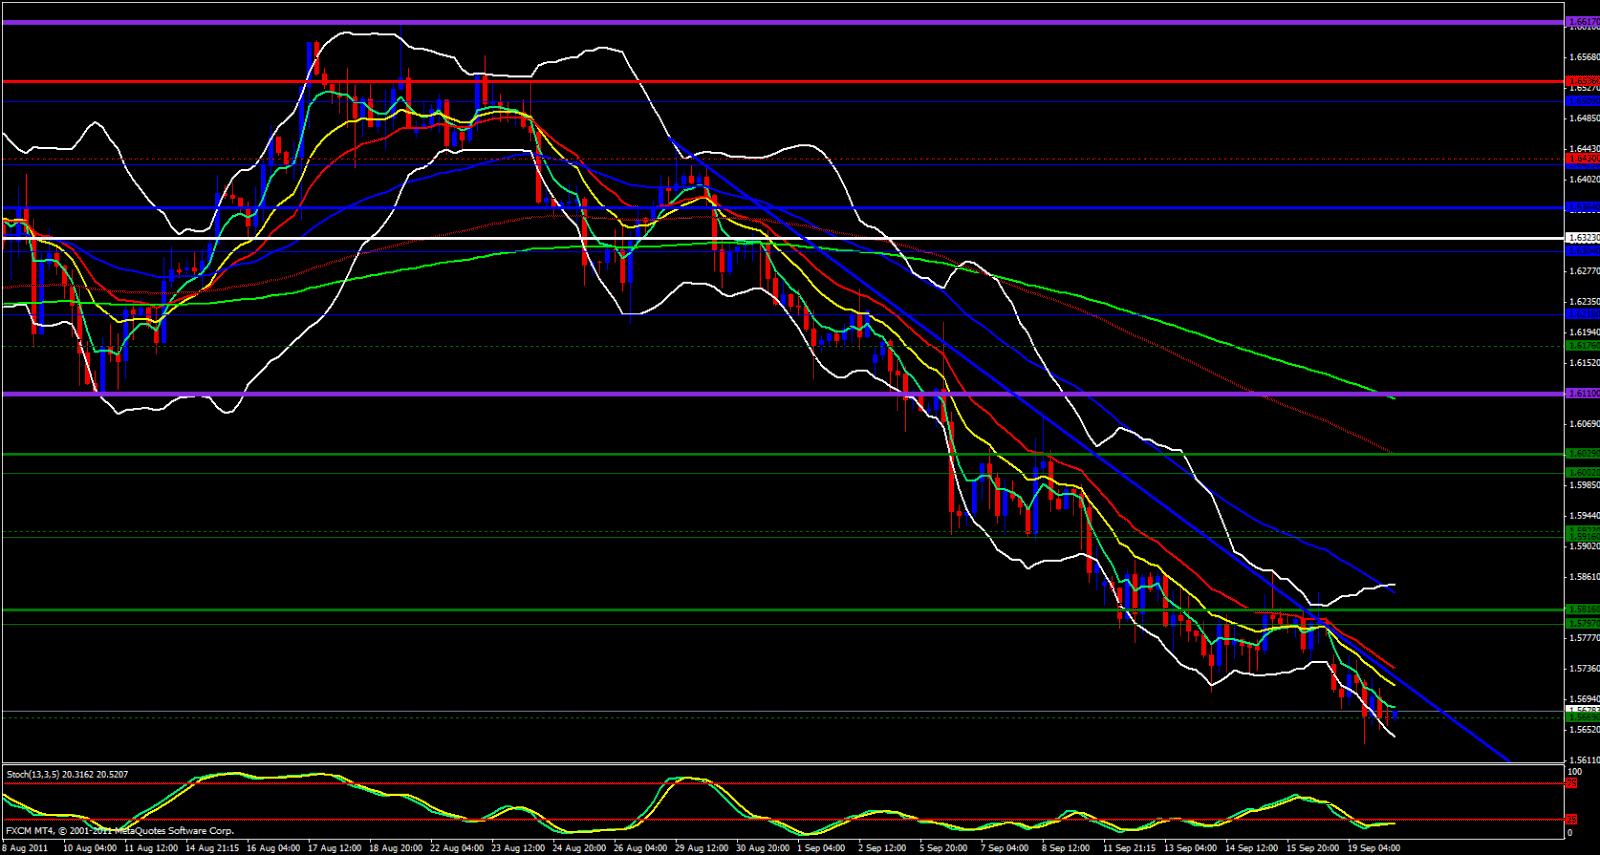
This pair continues to be bearish for the last several weeks and I don't see any reason for any of this to change. However, we cannot ignore the fact that on the weekly we are spaced quite a bit away from the 5 ema and outside of the lower Bollinger Band which is in fact bearish, however, as I have said before 80% of price action does take place within the Bollinger Bands.
.gif)
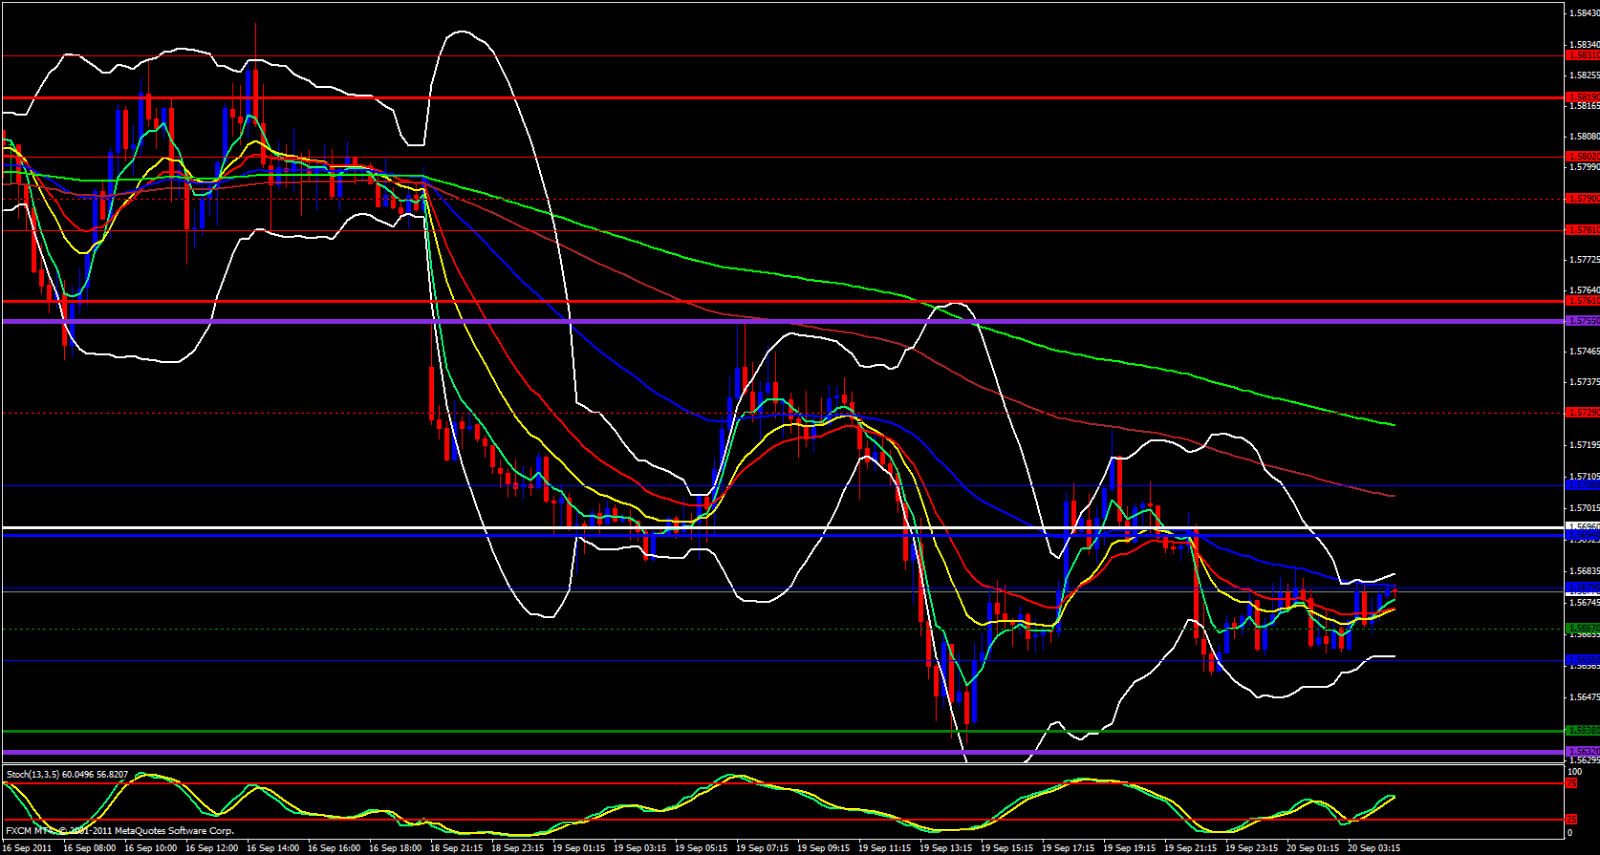
Looking at the hourly chart similar story. We are within the Bollinger Bands but spaced a bit away from the 5 ema. Price relies on the 5 ema to give it the push it needs to continue on its course. Price will either stall until the 5 catches up with it, meet the 5 halfway, or bounce off of some other area of support say off of a lower time frame chart, maybe off of a pivot point of some kind to force it up to the daily 5 ema so it can be pushed down further.

Looking at the 4 hour chart I see price is riding the 5 ema, very bearish but price is also against the Monthly M0 Pivot and the Stochastics is in the oversold zone. Looking at the hourly I see that price has bounced off the Weekly M1 and the 5 ema is rolling over to the upside.

Now, looking at the 15 minute chart I see that the 5 has crossed above the 13 and the 21 ema's and the upper Bollinger Band is pointing upward giving price permission to head up. The Daily 5 is at 1.5720 but will come down a bit because price will drag it down, and at the 1.5708 region we have the 15 minute 144 ema, and at the 1.5720 region we also have the hourly 55 ema and the 4 hour 13 ema is on the 1.5713 area. So I think it is likely for price to head in that direction, somewhere in between 1.5710 - 1.5720 region then drop from there.
I am not saying you should long your way to this zone, it will be a rocky road since there will be bears at every price level going against you. Just be patient and wait for price to reach these areas then look for some red and make your move.
