By: Doug Rosen
This pair continues to look extremely bearish on the long term as well as the short term.

Looking at the Monthly chart this pair already made its 38.2 Fib of the recent drop twice. The first time it hit the 38.2 fib it overlapped with the monthly 21 and 233 ema's. On the second fib the 55 ema had come into play after crossing below the monthly 144 and 233 ema's. At this time the monthly 5 ema is prepping to cross the 21 and 13 ema's while the Stochastics is crossing down from the overbought zone. The monthly chart is looking very bearish to me.

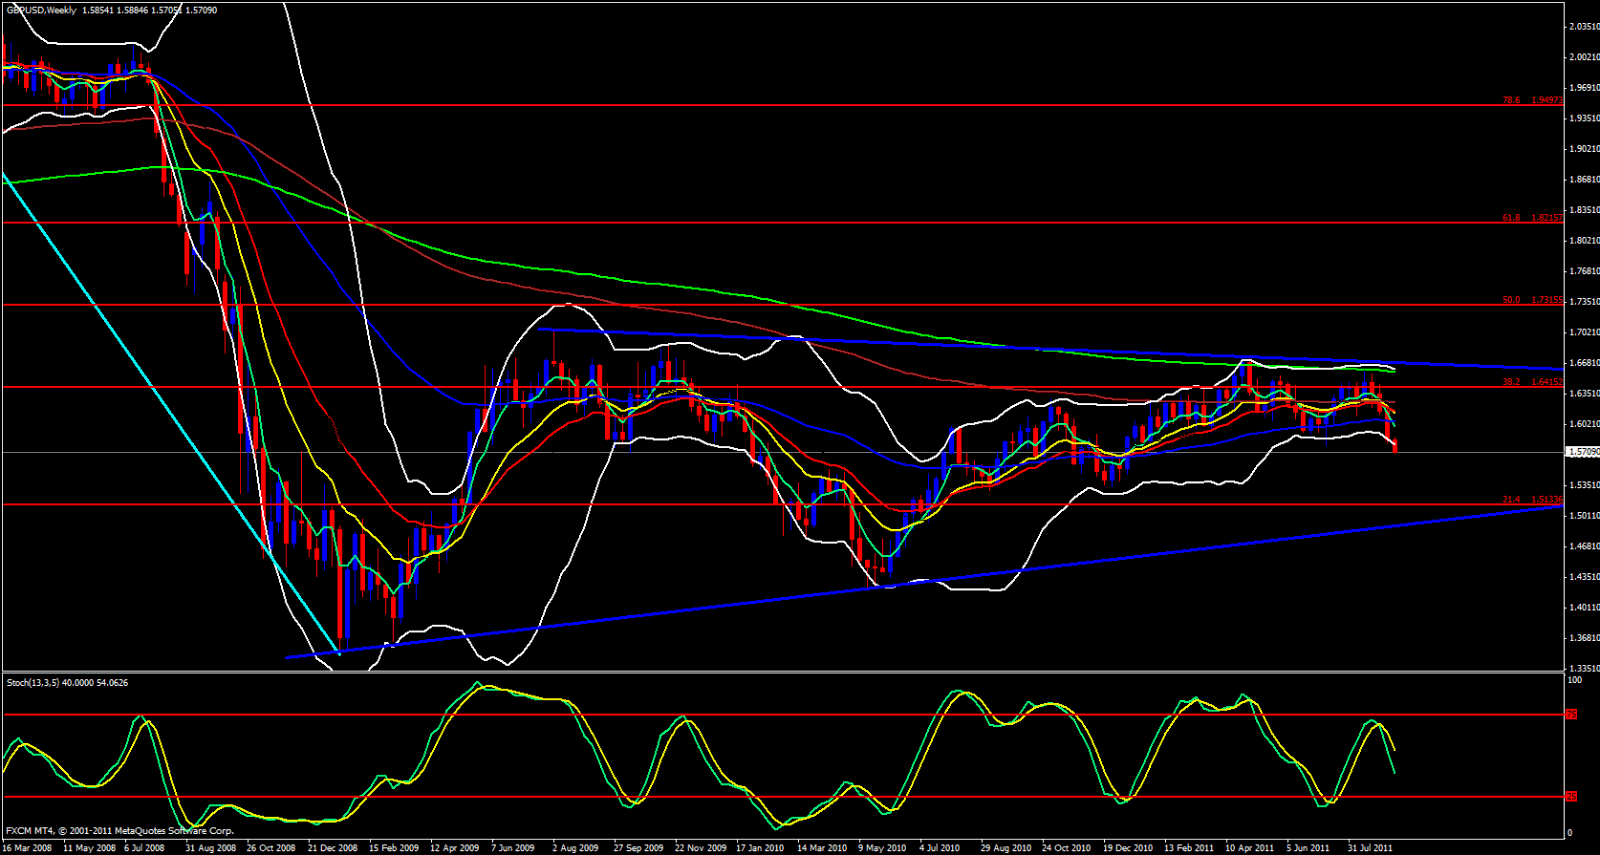
Moving over to the weekly chart it is obvious that the monthly 55 ema overlapped with the weekly 233 and upper Bollinger Band which further added to its bearish action. This bearish action was rather strong and currently price is slightly outside of its weekly Bollinger band and a bit separated from the 5 ema and Stochastics is reaching the oversold zone. There is really no major support in the way of this pair for the next 250 - 300 pips so I really dont expect too much in the way of pullbacks. What I do see on the weekly is that price may need to slow down just a bit and give the weekly 5 ema a chance to catch up with price while price gets positioned back inside the Bollinger Band so that it can continue its trip to the downside.

Moving over to the Daily chart I see that as with the weekly chart price is a bit seperated from the daily 5 ema and it needs that 5 to give it the pressure it needs to continue downward. On the daily price is within the Bollinger Bands and and not too far from the daily 5 ema but Stochastics is in the oversold zone. With all this being said I would expect price to come up just a bit and poke the daily 5 ema, possibly barely nick the daily 13 then to continue its trip downward. I expect to see price continuing down until it reaches 1.5100 region which coincides with the monthly and weekly trend line which is where it will finally reach a support area. I expect a fight at the 1.5350 area which is a support line and happens to be in between the 50.0 and 61.8 fib of the recent rise. At that point I would expect pullbacks back to the 1.5800 area then for price to continue downward to the 1.4900 region at which point will run into strong support.
