By: Colin Jessup
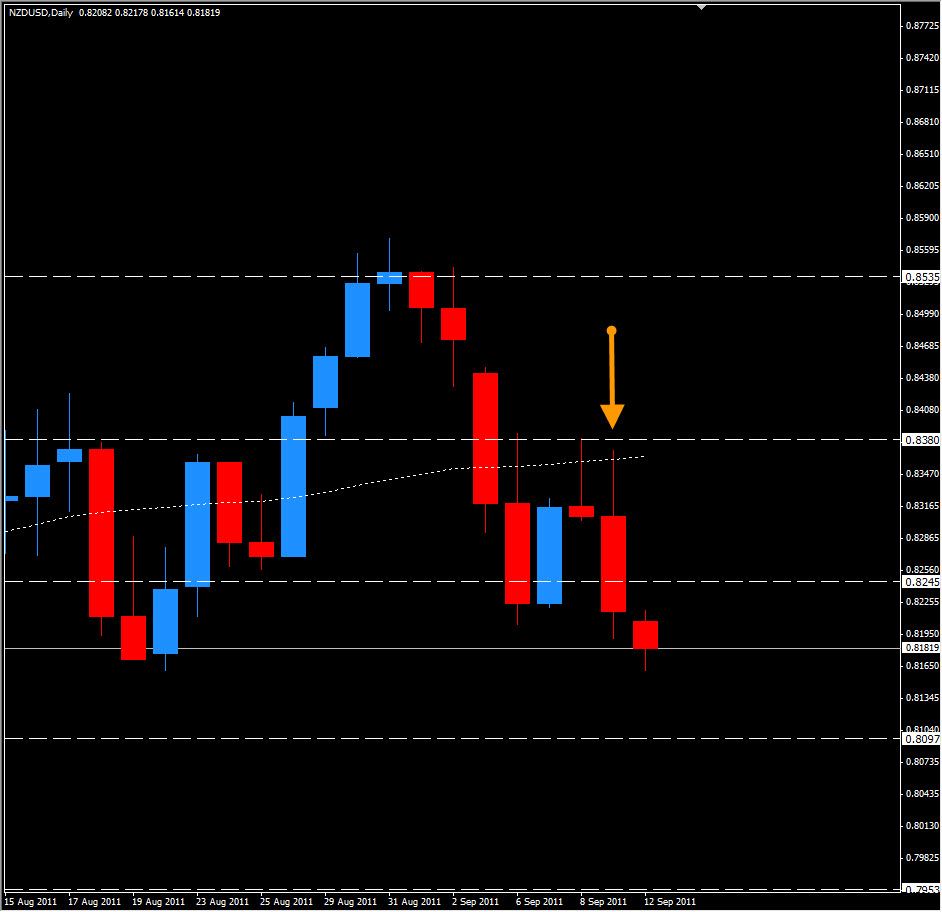
Here we have a daily chart of the Kiwi that shows price action finding some support at about 0.8175. This is no surprise with the previously established daily support of 0.8150 which held on August 19/20. We may see price bounce from this level again and create a double bottom, but the more likely scenario is that price will break below and try to retest support at 0.8100. If we break below 0.8100 look for price to free fall towards 0.7975 in an effort to reach the previous low from August 09, but price has had trouble staying below 0.8100 as of late so be cautious.
I am slightly bearish on this pair as we have closed below the moving average and a support zone, but should price break higher, look for resistance at 0.8250, 0.8320 & then 0.8380. Also take note if sentiment changes to bullish that we have the moving average at 0.8360 which will also act as resistance to the upside.
Happy Trading!

